
Analysis
- Namibia’s trade activities increased for 2022 in relation to 2021. Total exports for 2022 stood at N$96.4 billion, representing an increase of 46.3% from N$65.9 billion recorded in 2021 (See figure 1)
- In December 2022, the mining and quarrying exported goods to the value of N$4.3 billion, absorbing 49.7 percent of total exports followed by products from the manufacturing industry with an export value of N$3.2 billion
- Precious stones (diamonds) had the largest share in Namibia’s total exports ahead of uranium, followed by fish, non-monetary gold, and lastly fruits and nuts accounted for the least share
- Similarly imports depict an increase of 34.8% from N$128.3 billion compared to N$95.2 billion recorded in 2021 (See figure 2)
- The demand side was largely dominated by products from the manufacturing industry, with an import bill of N$6.8 billion while the mining and quarrying goods imported accounted for 27.9% of total imports for the month of December 2022
- Commodities that contributed most to the import bill during the month of December 2022 were petroleum oils, precious stones (diamonds), and motor vehicles for the transportation of goods
- Namibia recorded a trade deficit of N$1.1 billion for December 2022, reflecting an improvement of 59.5% and 49.9% when compared to the trade deficits recorded in November 2022 and December 2021 respectively (See figure 3). The improved trade deficit resulted mainly from a decline in the import bill
- The country did not record any trade surplus over the period of 2021 to 2022
Figure 1: Total exports value (N$ m), 2021 vs 2022

Figure 2: Total import value (N$ m), 2021 vs 2022

Figure 3: Trade balance (N$ m), 2021 vs 2022

Outlook
With Namibia being heavily reliant on international trade (imports), the country remains vulnerable tocommodityprice shocks brought by the confluence of factors in the global economic environment. Additionally, the continuous trade deficits and capital outflow could weigh on the economic recovery of the country, hence investment in value addition and incentives for local producers remains crucial for Namibia’s trade. We project the trade balance to remain subdued in the short to medium term.


Executive Summary
| Export | Export | Import | Import | Trade Deficit | Trade Deficit |
| July 2021 N$ 3.6 billion | July 2022 N$ 7.2 billion | July 2021 N$ 7.2 billion | July 2022 N$ 11.5 billion | July 2021 N$ 3.5 billion | July 2022 N$ 4.2 billion |
| Top 5 export products | Top 5 import products |
| Precious stones(diamonds) Fish Uranium Non-monetary gold Petroleum oils | Petroleum oils Copper ores and concentrates Ores and concentrates of precious metals Pearls and precious or semiprecious stones Civil engineering and contractors |
| Export destination | % share of export |
| Botswana South Africa China Zambia Netherlands | 20.5 19.8 10.0 8.8 6.6 |
| Main source import for Namibia | % share of import |
| South Africa Peru Bulgaria Imported from various countries India | 36.2 12.0 6.3 6.1 5.6 |
| Import mode of transport | % share |
| Sea Air Road Rail Multimodal | 35.0 33.5 31.4 0.0 0.0 |
Analysis
- Total export earnings declined by 14.8% for July 2022 when compared to June 2022. This was influenced by a decrease in uranium, fish, precious stones (diamonds), ores and concentrates of base metals, and printed matter
- On an annual basis, total export earnings increased by 99.6 % year on year on the back of the base effect of the Covid-19 pandemic. This resulted from an increase in the export earnings recorded for commodities such as precious stones (diamonds), uranium, petroleum oils, inorganic chemical elements, and copper ores and concentrates. This is an indication that the mining sector outperforms other sectors in exports earnings
- Import bills increased by 4.5% for July 2022 when compared to June 2022. This resulted from an increase in copper ores and concentrates, ores and concentrates of precious metals, precious stones (diamonds), motor vehicles for the transportation of goods, and alcoholic beverages
- On an annual basis, the total import bill increased by 60.1% year on year. This was influenced by an increase in the importation of petroleum oils, copper ores and concentrates, ores and concentrates of precious metals, pearls, and precious or semiprecious stones, civil engineering, and contractors' equipment (See figure 1 below)
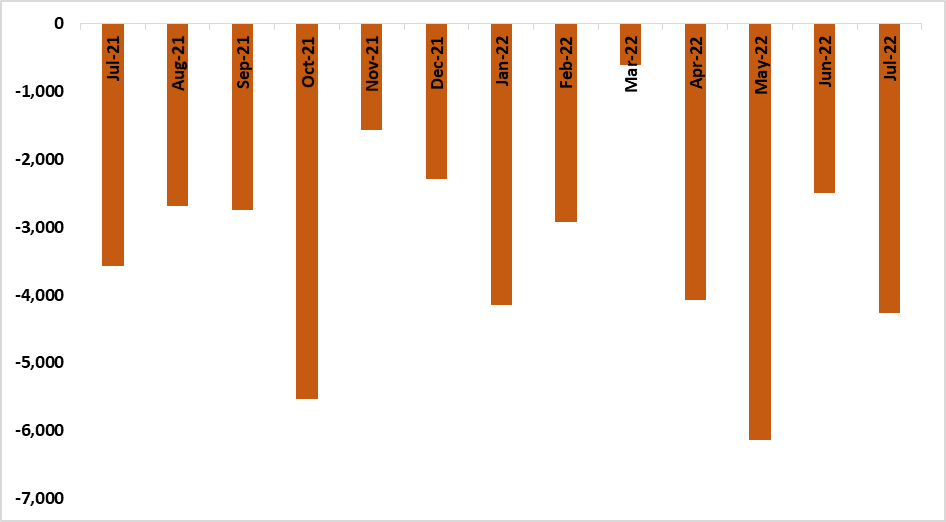
- The trade balance increased by 73.4% for July 2022 in relation to the same period last year (See figure 2)
Figure 1: Export and Import value N$ million, (July 2021 – July 2022)
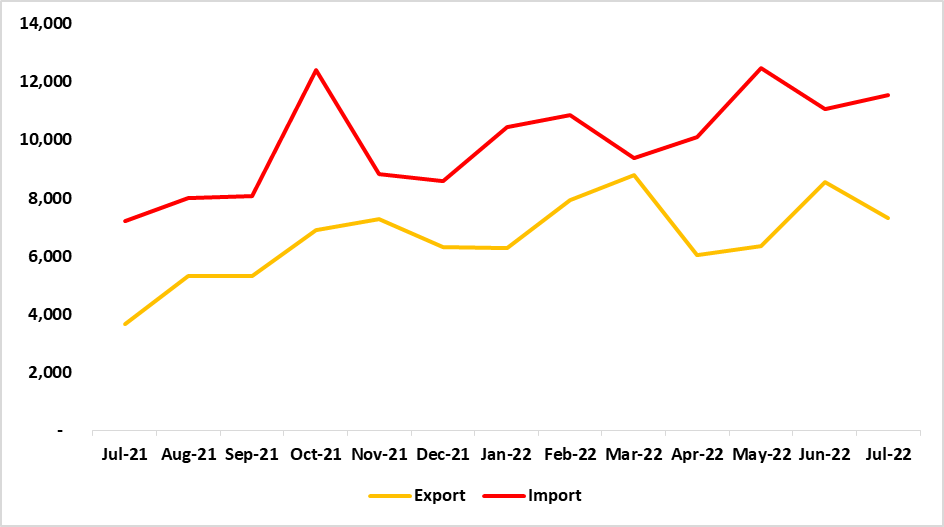
Figure 2: Trade Balance (July 2021 – July 2022)
Outlook
Namibia’s trade activities continue to improve in relation to the Covid-19-induced 2021. However, the country’s trade balance remains constrained when compared to the previous month. The country’s substantial reliance on imports poses a risk to Namibia’s trade given the uncertain current economic environment and the anticipated global economic recession. Boosting local productive capacity remains crucial to improving the overall trade balance for Namibia, this will trigger investment in value addition for the exported commodities.
Executive Summary
| Export | Export | Import | Import | Trade Deficit | Trade Deficit |
| June 2021 N$ 6.9billion | June 2022 N$ 7.9 billion | June 2021 N$ 8.3 billion | June 2022 N$ 10.4 billion | June 2021 N$ 1.4 billion | June 2022 N$ 2.4 billion |
| Top 5 export products | Top 5 Import Products |
| Precious stones (Diamonds) Uranium Fish Non-monetary gold Petroleum oils | Petroleum oils Inorganic chemical elements Civil engineering and contractors Precious stones (Diamonds) Fertilizers |
| Export destination | % Share of Export |
| Botswana South Africa France China Spain | 19.6 18.3 9.0 7.4 6.4 |
| Import Mode of Transport | % Share |
| Road Sea Air Inland Waterways Rail | 52.2 43.5 4.4 0.0 0.0 |
| Main Source of Import for Namibia | % Share of Import |
| South Africa India China Democratic Republic Of Congo Saudi Arabia | 35.3 19.2 7.2 5.5 2.7 |
Analysis
- Total export earnings increased by 26% for June 2022 when compared to that of May 2022. This was influenced by an increase in the exports of petroleum oils, uranium, precious stones (diamonds), ores, and concentrates of base metals
- On an annual basis, total export earnings increased by 15.1 % year on year. This resulted from an increase in the exports earnings recorded for commodities such as precious stones (diamonds), non-monetary gold, petroleum oils, and inorganic chemical elements
- Import bill declined by 15.9% for June 2022 when compared to May 2022. This was attributed to a decline in the import of copper ores and concentrates, sugars, molasses and honey, sulfur and unroasted iron pyrites, civil engineering, and contractors' equipment
- On an annual basis, the total import bill increased by 24.8 % year on year. This was influenced by an increase in the importation of petroleum oils, inorganic chemical elements, fertilizers, civil engineering, and contractors' equipment (See figure 1 below)
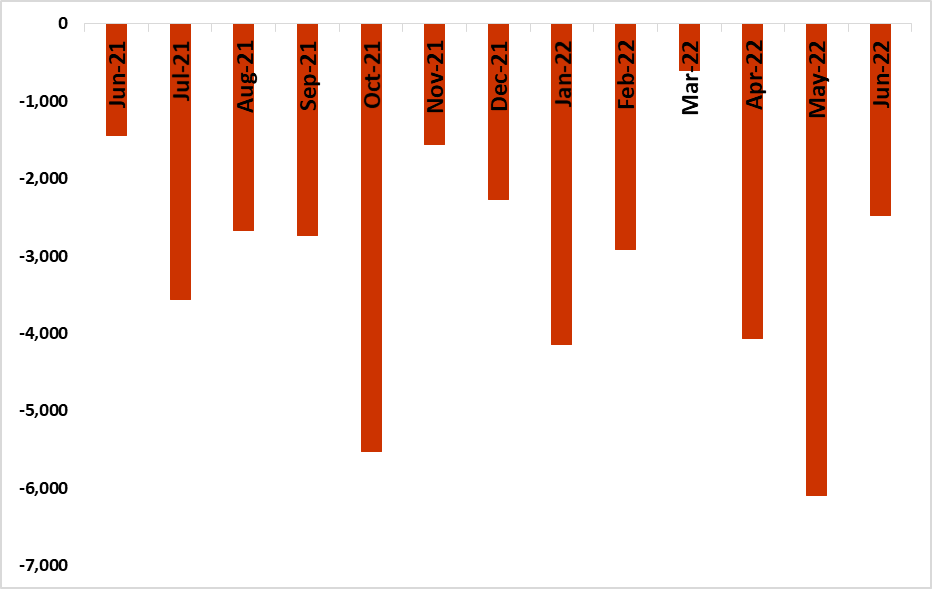
- The trade balance increased by 20.4% for June 2022 in relation to the same period last year (See figure 2)
Figure 1: Export and Import value N$ million, (June 2021 – June 2022)
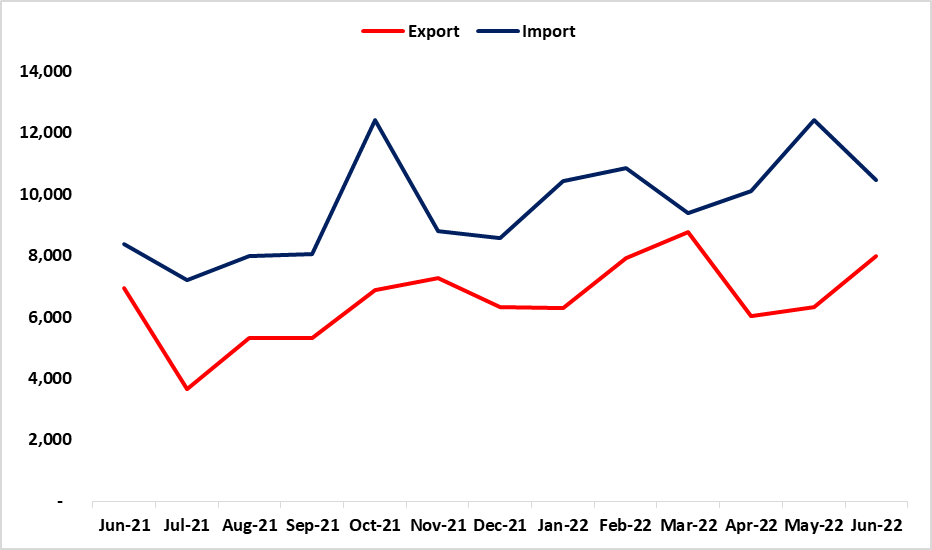
Figure 2: Trade Balance (June 2021 – June 2022)
Outlook
The trade deficit improved in relation to the previous month. This was influenced by a decline in imports augmented by a significant growth recorded for exports. The decline in imports was also influenced by fewer imports of productive assets such as civil engineering and contractor’s equipment which is a reflection of a contraction in the construction sector. The growth recorded in export earnings was influenced by global inflationary pressures augmented by the weaker value of the Rand against the USD for June 2022. The continuous global economic impediments coupled with the foreseen global recession might push the import bill up and hence widen the trade deficit in the short to medium term.
Executive Summary

Analysis
- Total export earnings declined by 5.2% for May 2022 when compared to April 2022. This was attributed to a decline in the exports of fish, uranium, non-monetary gold, and ores and concentrates of base metals
- On an annual basis, total export earnings increased by 42.1% year on year. This resulted from an increase in the exports earnings recorded for commodities such as copper blisters, petroleum oils, inorganic chemical elements, oxides, and halogen salts
- Import bill increased by 1.9% for May 2022 when compared to April 2022. This was influenced by an increase in the import of petroleum oils, civil engineering, and contractors' equipment, copper ores, and concentrates
- On an annual basis, total imports earnings increased by 55.4% year on year. This was influenced by an increase in the importation of petroleum oils, civil engineering, and contractors' equipment, sulphur, and unroasted iron pyrites (See figure 1 below)
- The trade balance increased by 50.4% for May 2022 in relation to the same period last year (See figure 2)
Figure 1: Export and Import value N$ million, (May 2021 – May 2022)

Figure 2: Trade Balance (May 2021 – May 2022)

Outlook
The country’s trade deficit widened in May when compared to April 2022. The “confluence of calamities” of spurring energy and commodity prices remains elevated augmented by the uncertainty related to the ongoing geopolitical tension between Russia and Ukraine, thus we anticipate sluggish growth in the country’s trade balance in the medium term.