Analysis
Monthly and Annual Sales Performance:
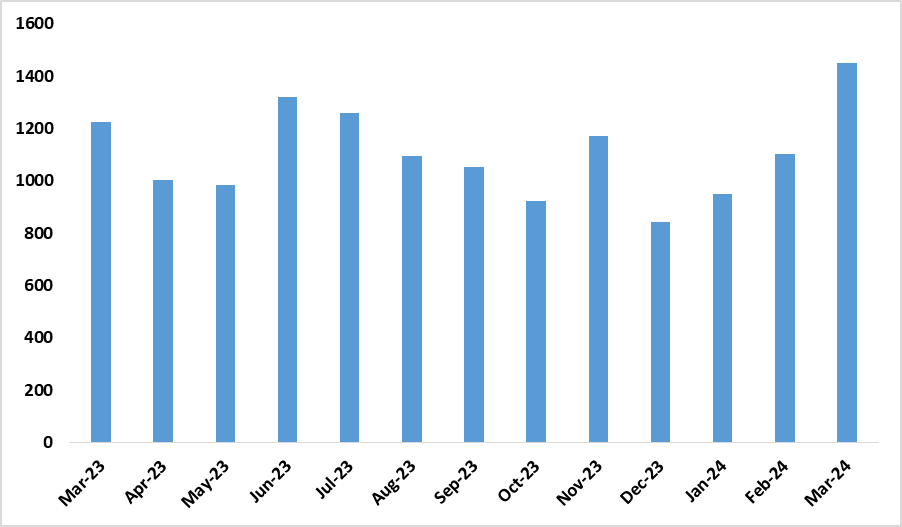
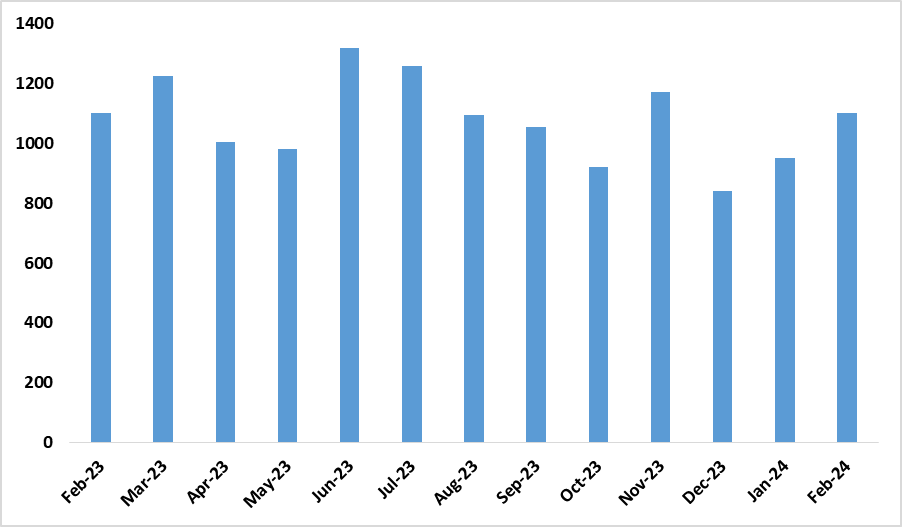
- In December 2023, a total of 841 vehicles were sold, marking a decline from the 1,171 vehicles sold in November 2023, representing a 28% monthly decline
- However, on an annual basis, vehicle sales increased by 11.7% compared to December 2022, with a total of 12,775 vehicles sold in 2023, representing a 16.9% annual increase compared to the same period in 2022.
Specific Vehicle Categories:
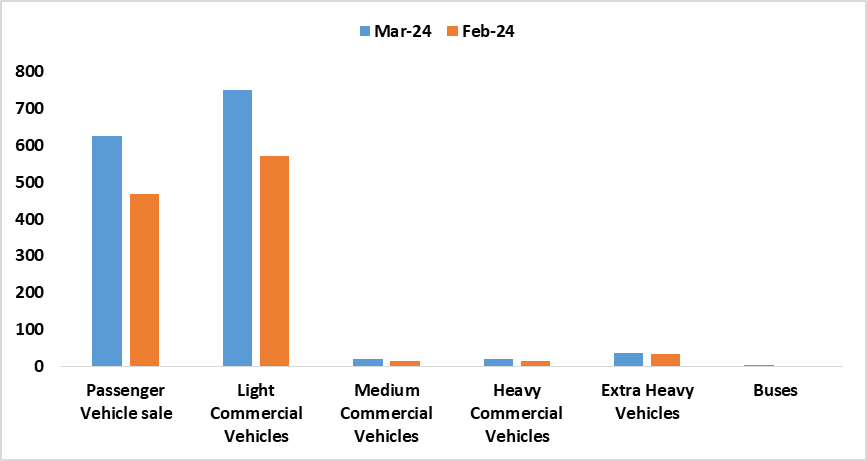
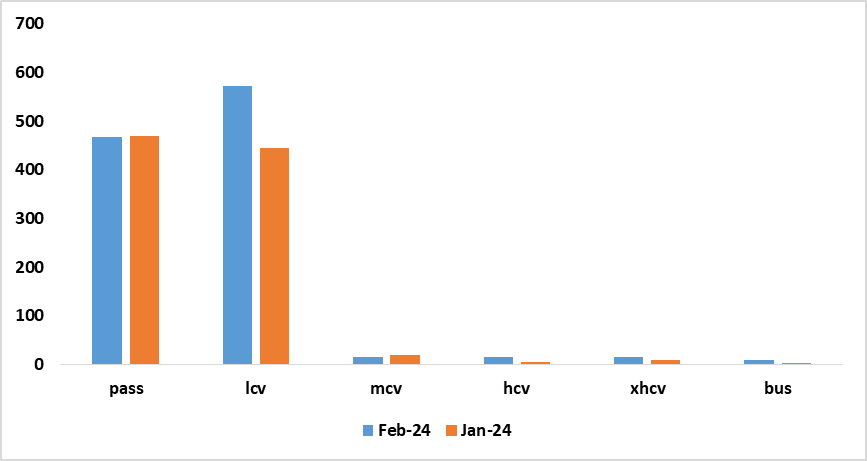
- Sales of passenger, light commercial, medium commercial, and extra heavy vehicles declined by 25%, 31%, 41.6%, and 100% month-on-month respectively.
- Notably, sales of heavy commercial vehicles and buses increased by 20% and 125% respectively.
Consumer Confidence and Market Outlook:
- The low vehicle sales for December 2023 are indicative of low consumer confidence, likely influenced by shifting consumer spending patterns during the festive season.
- The subdued sales of light, medium, and extra heavy vehicles could be attributed to reduced construction activities, leading to lower demand for heavy transportation services.
Table 1: Monthly vehicle sales by type
| Market | Dec-2023 | Nov-23 | Monthly unit change | Monthly % change |
| Passenger vehicles | 426 | 568 | (-142) | (-25) |
| Light commercial vehicles | 371 | 542 | (-171) | (-31.5) |
| Medium commercial vehicle sales | 14 | 24 | (-10) | (-41.6) |
| Heavy commercial vehicle sales | 6 | 5 | 1 | 20.00 |
| Extra heavy commercial vehicle sales | 15 | 28 | (-13) | (-46.43) |
| Bus | 9 | 4 | 5 | 125.00 |
Figure 1: Monthly Vehicle Sales (December 2023 vs. November 2023)

Source: Lightstone Auto & HEI RESEARCH
Figure 2: Month on Month, Vehicle Sales Growth (December 2022- December 2023)

Source: Lightstone (Pty) Ltd & HEI RESEARCH
Figure 3: Year on Year, Vehicle Sales Growth (December 2022- December 2023)

Source: Lightstone (Pty) Ltd & HEI RESEARCH
Outlook
Despite the monthly fluctuations, the demand for new vehicles has remained strong throughout the year 2023. This resilience in demand indicates underlying market stability and potential for recovery in specific vehicle categories. Additionally, the annual increase in vehicle sales signals overall market growth and resilience, providing a positive outlook for vehicle sales in 2024.
Executive summary
- During the month of November 2023, a total of 1,171 vehicles were sold, which represents an increase from the 922 vehicles sold in October 2023. This increase amounts to 249 vehicles, translating to a monthly increase of 27%.
- On an annual basis, vehicle sales increased by 12% compared to November 2022.
- In terms of specific vehicle categories, the sales of passenger, light commercial, medium commercial, extra heavy vehicles, and buses increased by 28%, 28%, 20%, 22%, and 100% respectively, month on month on the other hand, sales of extra heavy commercial vehicles declined by 38% month on month.
- From January until November 2023, a total of 11,934 vehicles were sold, representing a 20% annual increase compared to the same period in 2022.
Analysis
- An upswing in vehicle sales both monthly and annually, spanning from November 2023 to October 2023, may signify a boost in consumer confidence. This positive trend could be attributed to the steady interest rates, which have remained unchanged, creating a favourable environment for individuals looking to buy new vehicles
- Monthly low sales of extra heavy vehicles could be attributed to subdued construction activities which led to a low demand of heavy transportation services
| Market | Nov-23 | Oct-23 | Monthly unit change | Monthly % change |
| Passenger vehicles | 568 | 444 | 124 | 27.9 |
| Light commercial vehicles | 542 | 425 | 117 | 27.5 |
| Medium commercial vehicle sales | 24 | 20 | 4 | 20.0 |
| Heavy commercial vehicle sales | 5 | 8 | -3 | -37.5 |
| Extra heavy commercial vehicle sales | 28 | 23 | 5 | 21.7 |
| Bus | 4 | 2 | 2 | 100.0 |
Figure 1: Monthly Vehicle Sales (November 2023 vs. October 2023)

Source: Lightstone Auto & HEI RESEARCH
Figure 2: Month on Month, Vehicle Sales Growth (November 2022- November 2023)

Source: Lightstone (Pty) Ltd & HEI RESEARCH
Figure 3: Year on Year, Vehicle Sales Growth (November 2022- November 2023)

Source: Lightstone (Pty) Ltd & HEI RESEARCH
Outlook
The demand for new vehicles has remained strong throughout the year, but we expect a decline in vehicle sales for the month of December 2023. Historical data supports this trend, as December is typically a holiday month when people tend to prioritize spending on other things rather than purchasing new vehicles.
Executive Summary
During October 2023, new vehicle sales experienced a month-on-month decline of 13%, marking the fourth consecutive monthly decline. A total of 922 vehicles were sold in October 2023, compared to the 1054 vehicles sold in September 2023, reflecting a reduction of 132 vehicles. (Figure 1)
On an annual basis, vehicle sales decreased by 7.4% for October 2022 when compared to the same period last year. (Figure 1)
Month-on-month only medium commercial vehicles saw an increase in sales, by 18% whilst passenger, light commercial vehicles, heavy commercial vehicles, and extra heavy vehicles declined by 16%, 7%, 38%, and 36% respectively. Sales for busses remained unchanged.
During the first 10 months of 2023, 10764 vehicles were sold, comprising 4762 passenger vehicles, 4428 light commercial vehicles, 218 medium vehicles, 125 heavy commercial vehicles, 235 extra heavy commercial vehicles, and 14 buses. This resulted in a 21% annual growth compared to the corresponding period in the first 10 months of 2022.
Analysis
Total vehicle sales increased by 21% during the first 10 months of 2023 compared to the same period in 2022. This is an indication of overall improvement in consumer confidence. The continuous decline in monthly vehicle sales since June 2023 could be primarily attributed to diminished credit demand due to high-interest rates and eroded disposable income due to rising inflation.
The total sales of commercial vehicles experienced a 9% decline in October 2023, compared to the 524 units recorded in September 2023. This downturn underscores the suboptimal performance of the commercial sector.
Table 1: Monthly vehicle sales by type
| Market | Oct-23 | Sep-23 | Monthly unit change | Monthly % change |
| Passenger vehicles | 444 | 528 | -84 | -16 |
| Light commercial vehicles | 425 | 458 | -33 | -7 |
| Medium commercial vehicle sales | 20 | 17 | 3 | 18 |
| Heavy commercial vehicle sales | 8 | 13 | -5 | -38 |
| Extra heavy commercial vehicle sales | 23 | 36 | -13 | -36 |
| Bus | 2 | 2 | 0 | 0 |
Figure 1: Monthly Vehicle Sales (October 2023 vs September 2023)

Source: Lightstone Auto & HEI RESEARCH
Figure 2: Year on Year, Vehicle Sales Growth rate (October 2022- October 2023)

Source: Lightstone (Pty) Ltd & HEI RESEARCH
Outlook
The demand for new vehicles has exhibited resilience despite prevailing high-interest rates. However, looking ahead, we anticipate a continued month-on-month decline in vehicle sales in the short to medium term. This projection is influenced by the constraints on consumer confidence stemming from the persistent impact of inflation. As inflation erodes purchasing power and increases the overall cost of living, consumers may exhibit hesitancy in making significant financial commitments such as purchasing new vehicles. This, in turn, is expected to contribute to the anticipated decline in vehicle sales over the remaining months of 2023.
Executive Summary
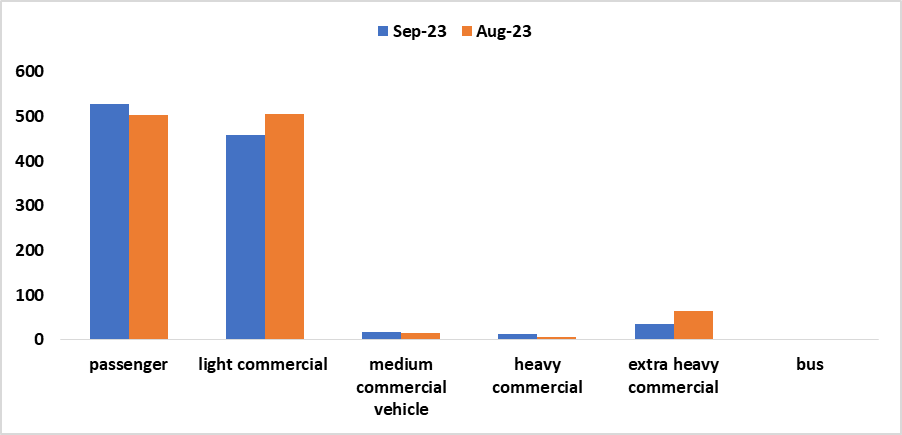
- During September 2023, new vehicle sales experienced a month-on-month decline of 3.7%, marking the third consecutive monthly decrease. A total of 1054 vehicles were sold in September 2023, compared to the 1094 vehicles sold in August 2023, reflecting a reduction of 40 vehicles. (Figure 1)
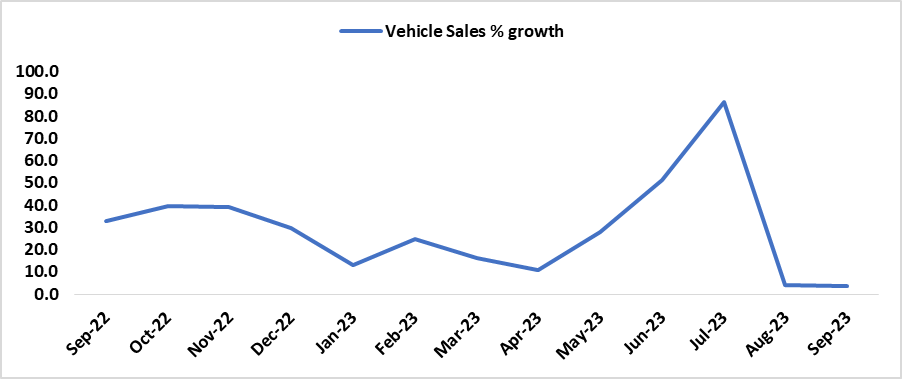
- On an annual basis, vehicle sales increased by 3.5% when compared to September 2022. (Figure 1)
- Month-on-month sales of passenger, medium commercial, and heavy commercial vehicles increased by 5%, 21%, and 86% while light commercial and extra heavy vehicles declined by 9% and 44% respectively.
- During the first 9 months of 2023, 9842 vehicles were sold, comprising 4318 passenger vehicles, 4002 light commercial vehicles, 198 medium vehicles, 117 heavy commercial vehicles, 212 extra heavy commercial vehicles, and 12 buses. This resulted in a 20% annual growth compared to the corresponding period in the first nine months of 2022
Analysis
- A 20% annual growth in new vehicles sold is an indication of overall improvement in consumer confidence
- The continuous decline in monthly vehicle sales since June 2023 could be primarily attributed to diminished credit demand due to high interest rates and eroded disposable income
- The rise in passenger vehicles could be due to no interest rate hike at the last Bank of Namibia’s MPC meeting. Consumers perceived this decision favorably, encouraging them to continue obtaining credit to purchase new cars
- Sales of light commercial vehicles could be attributed to subdued commercial activities hence a low demand for commercial transportation services
- Medium, heavy, and extra-heavy commercial vehicles continued on an upward trajectory. This could be mainly underpinned by the strong mining activity
- The total sales of commercial vehicles experienced an 11% decline in September 2023, compared to the 590 units recorded in August 2023. This downturn underscores the suboptimal performance of the commercial sector
Table 1: Monthly vehicle sales by type
| Market | Aug-23 | Sep-23 | Monthly unit change | Monthly % change |
| Passenger vehicles | 502 | 528 | 26 | 5 |
| Light commercial vehicles | 505 | 458 | -47 | -9 |
| Medium commercial vehicle sales | 14 | 17 | 3 | 21 |
| Heavy commercial vehicle sales | 7 | 13 | 6 | 86 |
| Extra heavy commercial vehicle sales | 64 | 36 | -28 | -44 |
| Bus | 2 | 2 | 0 | 0 |
Figure 1: Monthly Vehicle Sales (September 2023 vs August 2023)

Source: Lightstone Auto & HEI RESEARCH
Figure 2: Year on Year, Vehicle Sales Growth (September 2022- September 2023)

Source: Lightstone (Pty) Ltd & HEI RESEARCH
Outlook
The demand for new vehicles has exhibited resilience despite prevailing high-interest rates. Looking ahead, we anticipate a continued month-on-month decline in vehicle sales in the short to medium term. However, the expectation could be influenced otherwise by the upcoming Bank of Namibia's Monetary Policy Committee's decision on the 25th of October 2023.
Executive summary
- During the month of August 2023, 1094 vehicles were sold, from the 1260 vehicles sold in July 2023. This represented a monthly decline of 166 vehicles of 60 vehicles. This translated to a 13% monthly decline (Figure 1)
- On annual basis vehicle sales increased by 4% when compared to 1051 vehicles sold in August 2022, (Figure 1)
- Sales of extra heavy commercial vehicles and busses increased by 36%, and 200% month on month respectively.
- Passenger, light commercial, medium commercial, and heavy vehicles declined by 21%, 8%,18%, and 22% month on month respectively.
- A total of 7805 vehicles were sold during the first 8 months of 2023, a 13% annual increase when compared to the same period last year with a total of 3790 passenger vehicles, 3544 Light commercial vehicles, 181 medium vehicles, 104 heavy commercial vehicles, 176 extra heavy commercial vehicles, and 10 buses.
Analysis
- An increase in vehicle sales between August 2023 and August 2022 can be used as a proxy for consumer confidence
- The monthly decrease in vehicle sales between August and July 2023 was mainly attributed to the low sales of passenger and light commercial vehicle sales. This could be ascribed to low credit demand because of an increase in interest rates in July 2023
- Low sales of commercial vehicles could be attributed to subdued commercial activities hence a low demand for commercial transportation services, however, extra heavy commercial vehicles continue to show increased sales, which could be mainly underpinned by the strong mining activity. On a monthly basis, all commercial vehicle sales declined by 32% for August 2023 from 622 commercial vehicles which were recorded in July 2023. This indicates poor commercial sector performance.
Table 1: Monthly vehicle sales by type
| Market | Aug-23 | Jul-23 | monthly unit change | monthly % change |
| Passenger vehicles | 502 | 638 | -136 | -21 |
| Light commercial vehicles | 505 | 549 | -44 | -8 |
| Medium commercial vehicle sales | 14 | 17 | -3 | -18 |
| Heavy commercial vehicle sales | 7 | 9 | -2 | -22 |
| Extra heavy commercial vehicle sales | 64 | 47 | 17 | 37 |
| Bus | 2 | 0 | 2 | 200 |
Figure 1: Monthly Vehicle Sales (August 2023 vs. July 2023)

Source: Lightstone Auto & HEI RESEARCH
Figure 2: Year on Year, Vehicle Sales Growth (August 2022- August 2023)

Source: Lightstone (Pty) Ltd & HEI RESEARCH
Outlook
The demand for new vehicles has displayed notable resilience since the start of the year, and we anticipate that vehicle sales will continue to follow an upward growth trajectory in the short to medium term. This expectation may be influenced by the recent decision of the Bank of Namibia's Monetary Policy Committee to maintain the repo rate unchanged, as announced during their August meeting.
Executive summary
- Vehicle sales increased to 1320 vehicles for June 2023, from the 982 vehicles sold in May 2023. This represents a monthly increase of 34%. (Figure 1)
- Sales of passenger, light commercial, medium commercial, and heavy vehicles, extra heavy, and buses increased by 14.9%, 60.6%, 22.7% 57.1%, 12.8%, and 100% month on month respectively
- Out of 5113 vehicles sold during the first six months of 2023, 2650 were passenger vehicles, 2490 were Light commercial vehicles, 150 were medium vehicles, 88 were heavy commercial vehicles, 65 were extra heavy commercial vehicles and 8 were buses
Analysis
- The monthly increase in vehicle sales between June and May 2023 was mainly driven by high sales of light commercial vehicles. This could be ascribed to improved economic activity which drives the need for these vehicles for the transport of goods, materials, personnel, and equipment.
- On an annual basis, new vehicle sales in the first half of the year increased by 24%. This could indicate greater consumer spending and confidence, implying that individuals and businesses now have the financial capacity and willingness to invest in purchasing new vehicles, stimulating economic activity.
- Passenger vehicle sales increased to 580 vehicles from 505 vehicles sold in May 2023. This could have been influenced by a no increase in interest rates for the month of June.
- Light commercial vehicle sales increased to 657 in June 2023, up from 409 in May 2023. This indicates that the performance of the commercial services sector has improved.
Table 1: Monthly vehicle sales by type
| Market | May-23 | Jun-23 | Monthly unit change | Monthly % change |
| Passenger vehicles | 505 | 580 | 75 | 14.9 |
| Light commercial vehicles | 409 | 657 | 248 | 60.6 |
| Medium commercial vehicles | 22 | 27 | 5 | 22.7 |
| Heavy commercial vehicle | 7 | 11 | 4 | 57.1 |
| Extra heavy commercial vehicle | 39 | 44 | 5 | 0.1 |
| Bus | 0 | 1 | 1 | 1.0 |
Figure 1: Monthly Vehicle Sales (June 2023 vs. May 2023)

Source: Lightstone Auto & HEI RESEARCH
Figure 2: Year on Year, Vehicle Sales % Growth (May 2022- May 2023)

Source: Lightstone (Pty) Ltd & HEI RESEARCH
Outlook
The demand for new vehicle sales by individuals and businesses is still influenced by interest rates, enticing auto finance alternatives, and consumer confidence. Despite high interest rates and eroded consumer income caused by inflation and stagnating wages, demand for new vehicles has remained resilient. In the short to medium term, we believe that the demand for new vehicles will continue to rise, albeit at a slow pace.
Executive summary
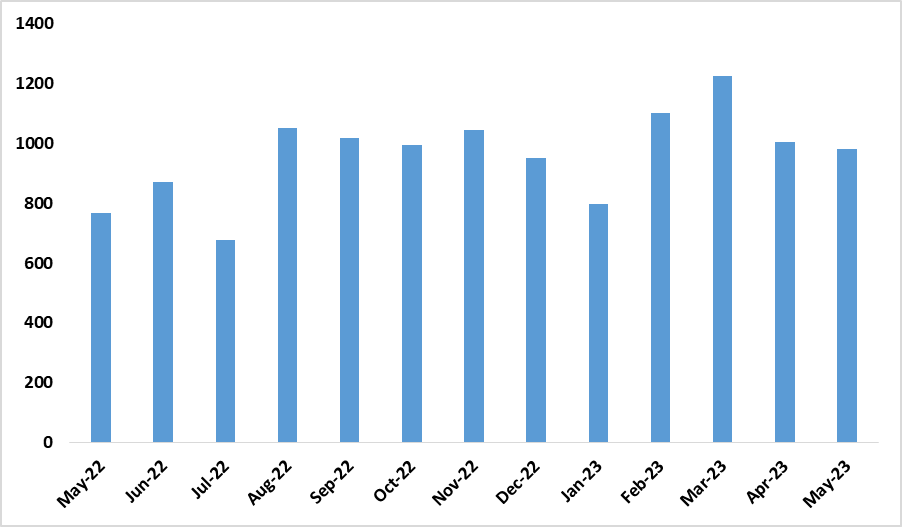
- New vehicle sales declined to 982 vehicles for May 2023, down from 1004 vehicles sold in April 2023. This represented a monthly decline of 2%. (figure 1)
- Sales of passenger, medium commercial, and heavy vehicles increased by 7.9%, 29.4%, and 16.7%, month on month respectively.
- Light commercial vehicle and bus vehicle sales decreased by 13.5% and -100%, respectively, in May 2023 compared to April 2023
- Out of 5113 vehicles sold for 2023, 2070 were passenger vehicles, 1833 were Light commercial vehicles, 123 were extra heavy vehicles, 77 were medium commercial vehicles, 21 were heavy commercial vehicles and 7 were buses.
Analysis
- The monthly decline in vehicle sales between May and April 2023 was mainly driven by the low sales of light commercial vehicle sales. This could be ascribed to low credit demand as a consequence of an increase in the interest rates in April, additionally, low sales of commercial vehicles could be attributed to subdued commercial activities hence a low demand for commercial transportation services
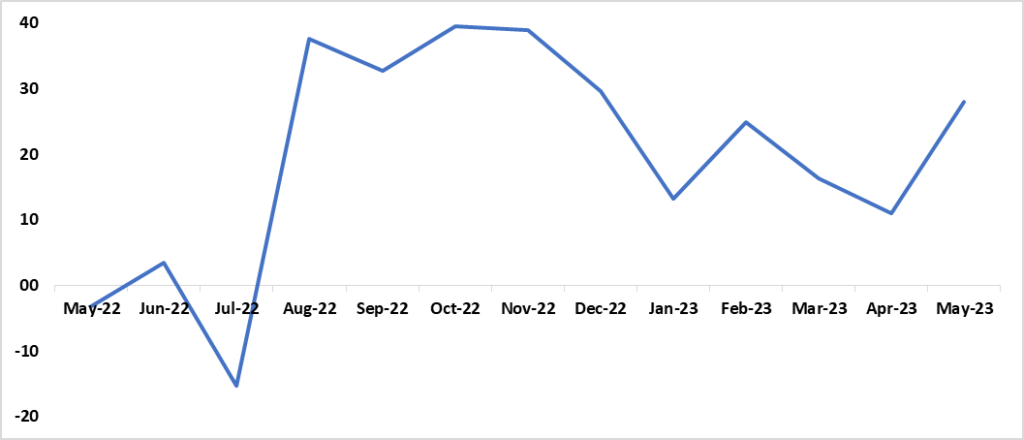
- On an annual basis, new vehicle sales in the first 5 months of the year increased by 18.5%. This implies an improvement in consumer confidence
- Passenger vehicle sales increased from 468 vehicles sold in April 2023 to 505 in May 2023. This could be attributed to the no increase in interest rates for the month of May.
- Light commercial vehicle sales declined to 409 for May 2023 from 473 which was recorded in April 2023. This could have been influenced by subdued commercial sector performance
- Heavy commercial vehicle sales decreased by one vehicle between May and April 2023
Table 1: Monthly vehicle sales by type
| Market | Apr-23 | May-23 | Monthly unit change | Monthly % change |
| Passenger vehicles | 468 | 505 | 37 | 7.9 |
| Light commercial vehicles | 473 | 409 | -64 | -13.5 |
| Medium commercial vehicles sales | 17 | 22 | 5 | 29.4 |
| Heavy commercial vehicle sales | 6 | 7 | 1 | 16.7 |
| Extra heavy commercial vehicle sales | 39 | 39 | 0 | 0% |
| Bus | 1 | 0 | -1 | -100 |
Figure 1: Monthly Vehicle Sales (May 2022 – May 2023)

Source: Lightstone Auto & HEI RESEARCH
Figure 2: Year on Year, Vehicle Sales Growth (May 2022- May 2023)

Source: Lightstone (Pty) Ltd & HEI RESEARCH
Outlook
The high-interest rates and inflation have to the erosion of purchasing power for businesses and households, however, the demand for new vehicles has been resilient. The magnitude of interest rate hikes, the level of inflation, and the state of the economy will all have an impact on new vehicle sales in the short to medium term.
Executive summary
- New vehicle sales declined to 1004 vehicles for April 2023, down from 1226 vehicles sold in March 2023. This represented a monthly decline of 18.1%. (Figure 1)
- Sales of passenger, light commercial, medium commercial, and extra heavy vehicles declined by 18.6%, 18.4%, 26.1%, and 2.5% month on month respectively.
- Heavy commercial and bus vehicle sales increased by one and two vehicles, respectively, in April 2023 compared to March 2023
- In the first four months of 2022, 4131 vehicles were sold, compared to 3547 vehicles sold in the same period last year
- Out of 4131 vehicles sold for 2023, 2070 were passenger vehicles, 1833 were Light commercial vehicles, 123 were extra heavy vehicles, 77 were medium commercial vehicles, 21 were heavy commercial vehicles and 7 were buses
Analysis
- Notwithstanding a monthly decline in vehicles sold between April and March 2023, the month of April 2023 recorded the highest number of vehicles sold in April since 2016
- The monthly decline in vehicle sales between April and March 2023 was mainly driven by the low sales of passenger vehicles and light commercial vehicle sales. This could be ascribed to low credit demand as a consequence of an increase in the interest rates in April, additionally, low sales of commercial vehicles could be attributed to subdued commercial activities hence a low demand for commercial transportation services
- On an annual basis, new vehicle sales increased by 10.6%. This implies an improvement in consumer confidence.
- Passenger vehicle sales declined from 575 vehicles sold in March 2023 to 468 in April 2023. This could be attributed to an increase in interest rates and the unavailability of affordable vehicle financing options
- Light commercial vehicle sales declined to 473 for April 2023 from 580 that was recorded in March 2023. This could have been influenced by subdued commercial sector performance
- Heavy commercial vehicle sales increased by one vehicle between April and March 2023. This could be attributed to an improvement in demand for heavy transportation services
Table 1: Monthly vehicle sales by type
| Market | Mar-23 | Apr-23 | Monthly unit change | Monthly % change |
| Passenger vehicles | 575 | 468 | -107.0 | -18.6 |
| Light commercial vehicles | 580 | 473 | -107.0 | -18.4 |
| Medium commercial vehicles sales | 23 | 17 | -6.0 | -26.1 |
| Heavy commercial vehicle sales | 5 | 6 | 1.0 | 20.0 |
| Extra heavy commercial vehicle sales | 40 | 39 | -1.0 | -2.5 |
| Bus | 3 | 1 | -2.0 | -66.7 |
Figure 1: Monthly Vehicle Sales (April 2022 – April 2023)

Source: Lightstone Auto & HEI RESEARCH
Figure 2: Year on Year, Vehicle Sales Growth (April 2022- April 2023)

Source: Lightstone (Pty) Ltd & HEI RESEARCH
Outlook
The high-interest rates and inflation led to the erosion of purchasing power for businesses and households, however, the demand for new vehicles has been resilient. We are of the view that the magnitude of interest rate hikes, the level of inflation, and the state of the economy will all have an impact on new vehicle sales in the short to medium term.
Executive summary
- New vehicle sales increased to 1226 vehicles in March 2023, up from 1103 vehicles sold in February 2023. This equated to an 11.2% monthly increase. (Figure 1)
- The upsurge in vehicle sales can be ascribed to an increase in the sales of extra heavy vehicles and light commercial vehicles
- Heavy commercial vehicle sales declined by 38%. The increase in new vehicle sales was primarily driven by strong market sales of commercial vehicles
- A total of 3127 vehicles were sold during the first three months of 2023
Analysis
- On an annual basis, new vehicle sales increased by 16.3%, (Figure 2). This could be ascribed to increased consumer confidence
- Extra heavy commercial vehicle sales increased by 66.7% for March 2023 when compared to February 2023. This could have been influenced by an expansion of industrial sectors which translated into a growing demand from the logistics industry and rising demand from the construction sector (owing to improved construction activities).
- On a monthly basis, light commercial vehicle sales increased by 19.3%. This could be a consequence of increased light business activity
- Passenger vehicle sales increased by 2.9% between February 2023 and March 2023, owing to increased consumer confidence. (Table 1)
Table 1:
| Market | Feb-23 | Mar-23 | Monthly unit change | Monthly % change |
| Passenger vehicles | 559 | 575 | 16 | 2.9 |
| Light commercial vehicles | 486 | 580 | 94 | 19.3 |
| Medium commercial vehicles sales | 25 | 23 | -2 | -8.0 |
| Heavy commercial vehicle sales | 8 | 5 | -3 | -37.5 |
| Extra heavy commercial vehicle sales | 24 | 40 | 16 | 66.7 |
| Bus | 1 | 3 | 2 | 200.0 |
Figure 1: Monthly Vehicle Sales (March 2022 – March 2023)

Figure 2: Year on Year, Vehicle Sales Growth (March 2022- March 2023)

Outlook
The demand for new vehicles has been resilient despite interest rate hikes. We anticipate the market for new vehicles to maintain its momentum on the road to recovery as the economic climate continues to improve.