The National occupancy rates increased to 40.7 % for March 2023. National occupancy increased by 9% when compared to February 2023 (figure 1). On a quarterly basis, the country recorded 36.8% national occupancy rates. This reflected the best first-quarter occupancy rate since the onset of the pandemic, and so the local tourism sector is off to a good start in the new year (figure 2). The Central part of the country recorded the highest occupancy rate of 52.68% for March 2023 followed by the Southern part recording 41.10% and the northern part of the country recorded the lowest occupancy rate of 34.56% (figure 3). Positive national occupancy numbers signify a positive recovery for Namibia’s tourism sector.
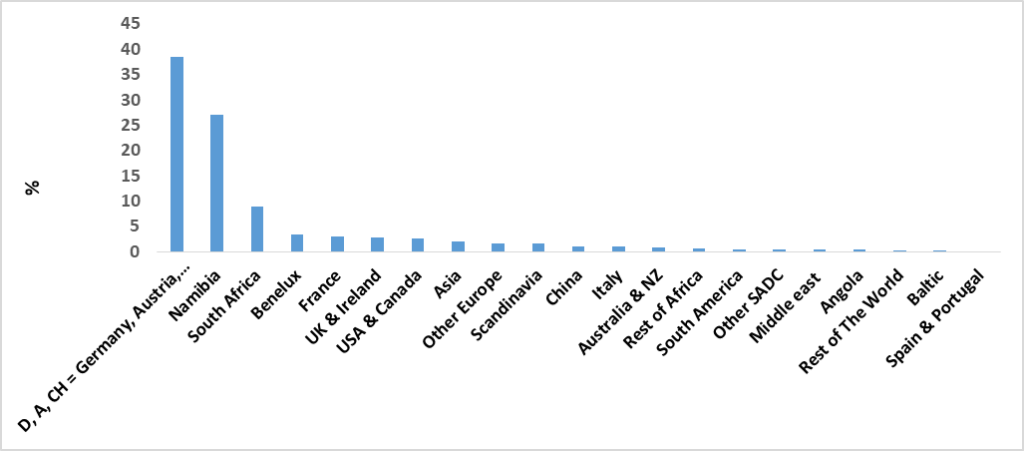
According to the Hospitality Association of Namibia, the country recorded an increase in visitors from main source markets, (D, A, CH = Germany, Austria, and Switzerland), which made up 37% of all accommodation for the first three months of 2023 compared to 26,6% recorded during the same period in 2019. The USA market contribution was also slightly up for 2023 when compared to 2019. Furthermore, the international market contributed the most to national occupancy rates during the month under review, accounting for 72.9% of national occupancy rates, with German, Austria, and Switzerland) recording the highest demand of 38% of the national accommodation services.
The performance of the sector remains positive for 2023. This is due to positive sentiments expected for national occupancy rates. The recent arrival of the Queen Mary 2 cruise liner with 2,000 guests could also increase the national occupancy rate specifically in the coastal part of the country. Additionally, the Namibian Ports Authority also expects 26 more passenger vessels to arrive at the port between March and May this year. This will further boost the performance of the tourism industry which in turn would lead to high demand for accommodation services resulting in the sector’s full recovery.
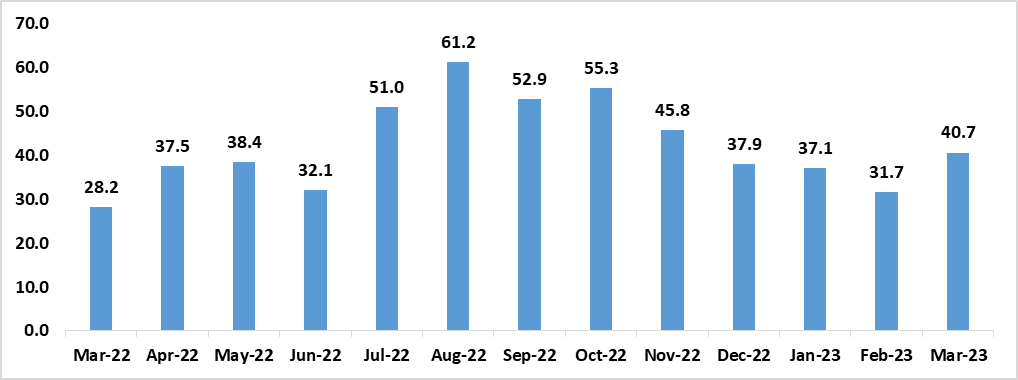
Figure 2: National Occupancy rates vs. HKIA arrivals rooms and beds occupancy rates, Namibia (March 2022- March 2023)
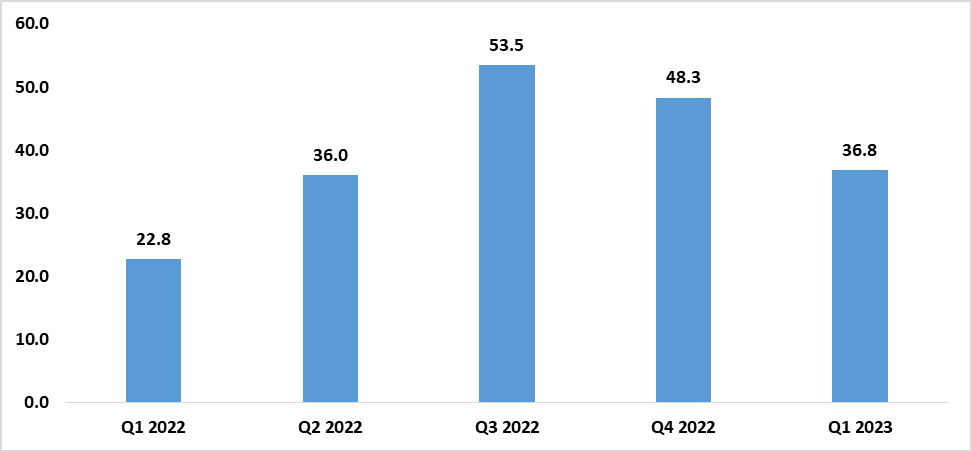
Figure 3: Occupancy rates by country, March 2023)