Report by Monika Kristof
Executive summary
- The annual inflation rate for June 2021 shot up to 4.1% up from 2.1 % recorded for June 2020. See Figure 1.
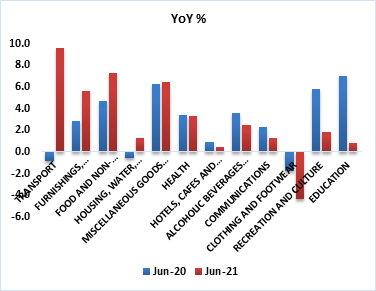
- The main drivers of an increase in the annual inflation rate were transport, furnishings, household equipment and routine maintenance of the house ,food and non-alcoholic beverages, housing, water ,electricity, gas and other fuels and miscellaneous good and services. See figure 2
- The category of clothing and footwear recorded a deflation for June 2021 which is an indication of huge pressure on the retail industry.
Analysis
- Transport category recorded a huge increase in the annual inflation rate from (-0.8%) to (9.6%), this was mainly influenced by high costs of operation of personal transport equipment and a cost push increase for vehicles due to supply disruptions.
- Furnishings, household equipment and routine maintenance of the house recorded an increase in the annual inflation rate from (2.8%) to (5.6%), this was influenced by an increase in the prices of household textiles, carpets and other floor coverings.
- Food and non-alcoholic beverages annual inflation rate increased from (4.7%) to (7.3%), this was influenced by an increase the prices of meat, oils and fats due to cost push inflation.
- The annual inflation rate for housing, water, electricity, gas and other fuels increased from (-0.6%) to (1.3%), this was due to an increase in the costs of regular maintenance and repair of dwelling.
- The annual inflation rate for miscellaneous goods and services increased from (6.3%) to (6.4), this was influenced by the high demand for financial services.
- The annual inflation rate for hotels, cafes, and restaurants declined from (0.9%) to (0.4%), this was due to a lack of demand for accommodation services and Covid-19 restrictions.
Outlook
- We anticipate an increase in the annual inflation rate for July 2021, due to the heightened supply chain disruptions which will be imported by our biggest trading partner, South Africa.
Figure1: Annual inflation rate
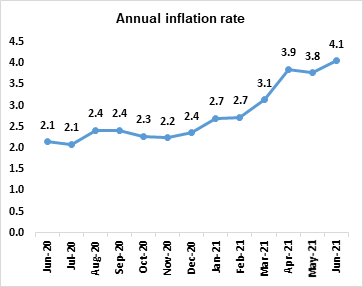
Figure 2: Categorical analysis Year on Year %