HEI Fixed Income Market Commentary
- As the price of Brent crude traded at prices last seen in February this year after news reports that OPEC+, the petroleum consortium, could discuss a supply increase of 500,000 barrels during the next meeting.
- While the Namibian Stock Exchange (NSX) declined by 0.97% yesterday, bond yields indicated some positive sentiments as yield curves displayed an upward trajectory. Spreads between Namibia’s yields and South Africa’s yields are extremely volatile as an aftermath of S&P Global’s positive rating outlook on South African local and foreign debt.
- In South Africa, the yield curves are continuing to decline drastically as market forces are causing investors to rearrange their portfolio’s holdings on Fixed Income securities
Table 1. Namibia Government Bonds
| Bonds | Coupon | Maturity | YTM (%) | YTM (%) | YTM (%) | DTDΔ | Prices |
| 04-Nov-22 | 18-Nov-22 | 21-Nov-22 | (bps) | 21-Nov-22 | |||
| GC23 | 8.85 | 15-Oct-23 | 8.73 | 8.78 | 8.81 | 2.32 | 100.02 |
| GC24 | 10.5 | 15-Oct-24 | 8.39 | 8.12 | 8.11 | -1.20 | 104.13 |
| GC25 | 8.5 | 15-Apr-25 | 8.75 | 8.86 | 8.85 | -1.40 | 99.25 |
| GC26 | 8.5 | 15-Apr-26 | 8.75 | 9.25 | 9.24 | -1.30 | 97.86 |
| GC27 | 8 | 15-Jan-27 | 9.56 | 9.34 | 9.33 | -1.20 | 95.48 |
| GC28 | 8.5 | 15-Oct-28 | 11.17 | 10.90 | 10.90 | -0.20 | 89.74 |
| GC30 | 8 | 15-Jan-30 | 11.54 | 11.21 | 11.24 | 2.65 | 84.36 |
| GC32 | 9 | 15-Apr-32 | 11.89 | 11.56 | 11.59 | 2.76 | 85.37 |
| GC35 | 9.5 | 15-Jul-35 | 12.96 | 12.96 | 13.00 | 3.36 | 78.53 |
| GC37 | 9.5 | 15-Jul-37 | 13.09 | 13.23 | 13.26 | 3.24 | 75.93 |
| GC40 | 9.8 | 15-Oct-40 | 13.22 | 12.97 | 13.01 | 3.51 | 77.89 |
| GC43 | 10 | 15-Jul-43 | 14.21 | 14.32 | 14.30 | -2.25 | 71.63 |
| GC45 | 9.85 | 15-Jul-45 | 14.21 | 14.40 | 14.39 | 248.82 | 69.77 |
| GC48 | 10 | 15-Oct-48 | 14.58 | 14.76 | 14.78 | 1.57 | 68.91 |
| GC50 | 10.25 | 15-Jul-50 | 14.75 | 14.84 | 14.85 | 1.57 | 69.56 |
Source: BoN & HEI Research
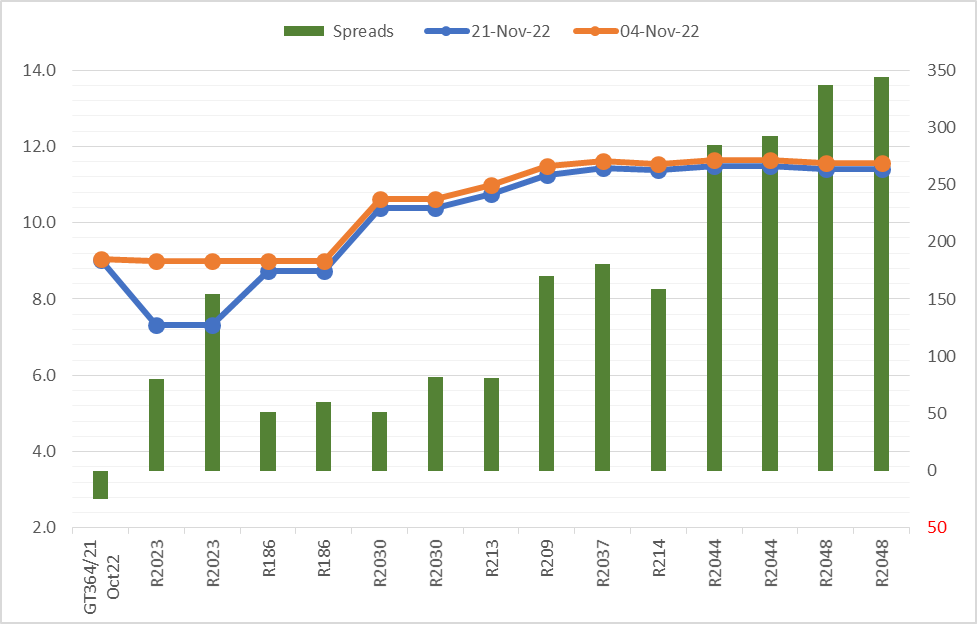
Figure 1. Namibia Bond Yield: 04-Nov-2022 vs. 21-Nov-2022
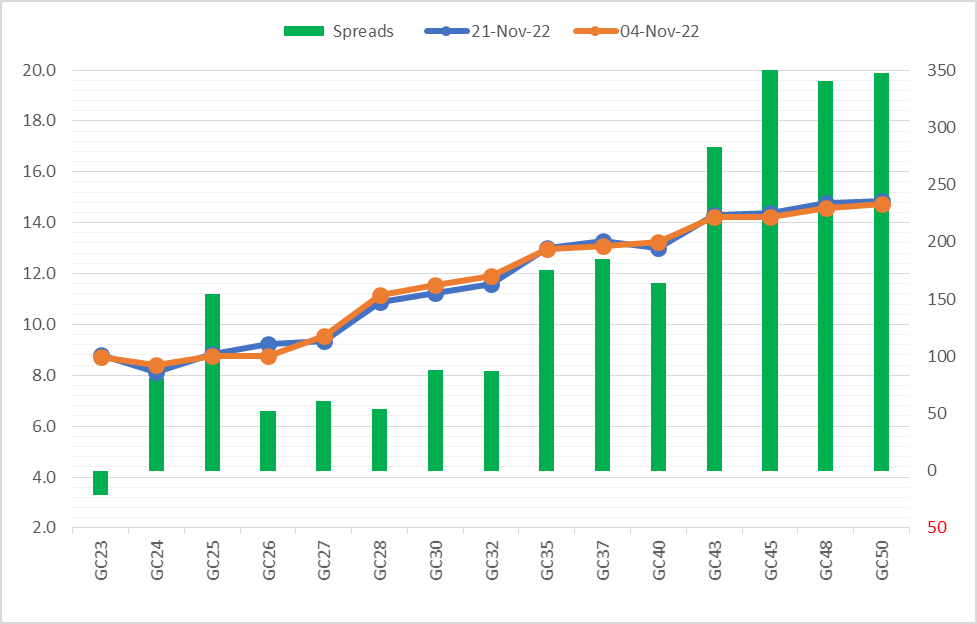
Figure 1. South African Bond Yields: 01-Nov-2022 vs. 18-Nov-2022