Report by Turimuye Uandara
Executive summary
- The annual inflation rate for January 2022 increased to (4.6%), up from (2.7%) recorded for the same period last year. See figure 1
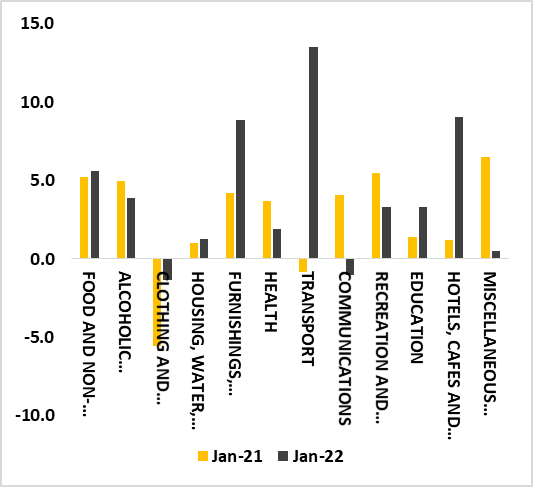
- The main drivers of an increase in the annual inflation rate were transport, hotels, cafes and restaurants, furnishing, household equipment and maintenance of the house, clothing, and footwear, and education categories. See figure 2
- On a monthly basis, Namibia recorded an inflation rate of 1.1% in January 2022 when compared to 0.4% in December 2021
- The main contributors to the monthly inflation rate recorded in January 2022 were mainly hotels, cafes, and restaurants, furnishing, household equipment and maintenance of the house, and education
Analysis
- The transport category recorded an increase in the annual inflation rate from (-0.8%) to (13.5%). This was mainly influenced by high fuel prices and transport fares
- Hotels, cafes, and restaurants recorded an increase in the annual inflation rate from (1.2%) to (9.0%). This was driven by an increase in the demand for accommodation services
- Furnishings, household equipment, and routine maintenance of the house recorded an increase in the annual inflation rate from (4.2%) to (8.9%) as a consequence of an increase in the price levels of goods and services for routine household maintenance
- The annual inflation rate for clothing and footwear increased from (-5.6%) to (-1.4%) as a result of an increase in the price levels of footwear, adult footwear, and dry cleaning, repair, and hire clothing
- The annual inflation rate for education increased from (1.4%) to (3.3%) due to an increase in the costs of pre-primary education, secondary and tertiary education
Outlook
- The transport category continues to be the main driver of inflation for Namibia. We anticipate that the annual inflation rate for February 2022 will increase augmented by the inflationary global environment.
Figure 1: Annual Inflation rate
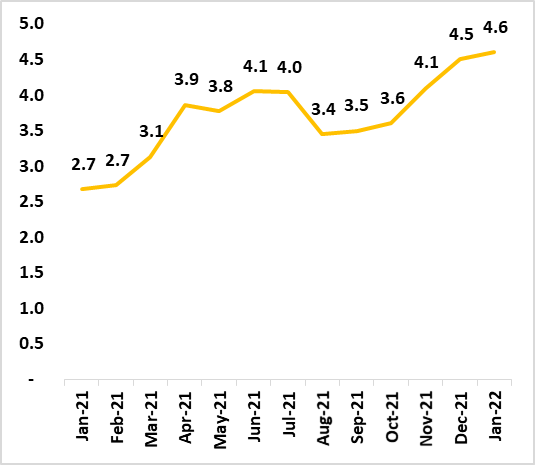
Figure 2: Categorical analysis Year on Year %, Namibia