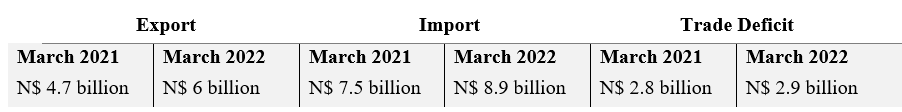
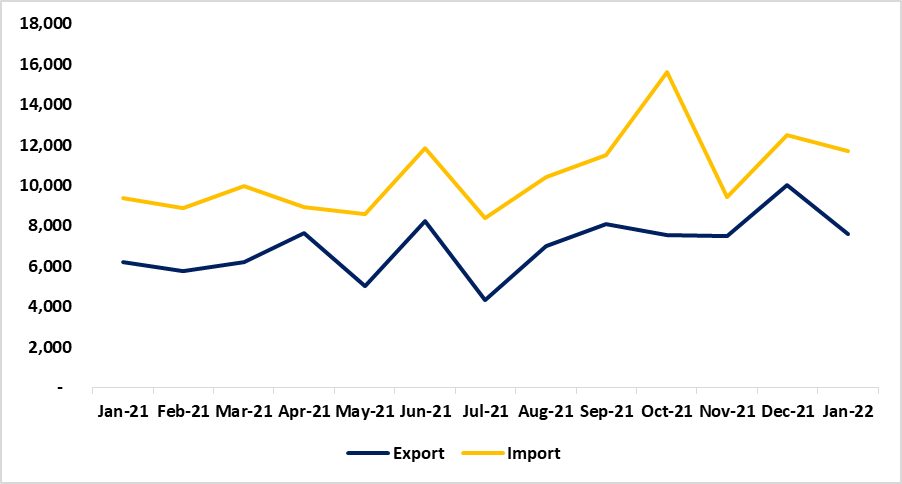
Total export earnings declined by 3.4% for March 2022 when compared to February 2022. This was attributed to a drop in the exports of non-monetary gold, fish, printed matter, medicinal and pharmaceutical products
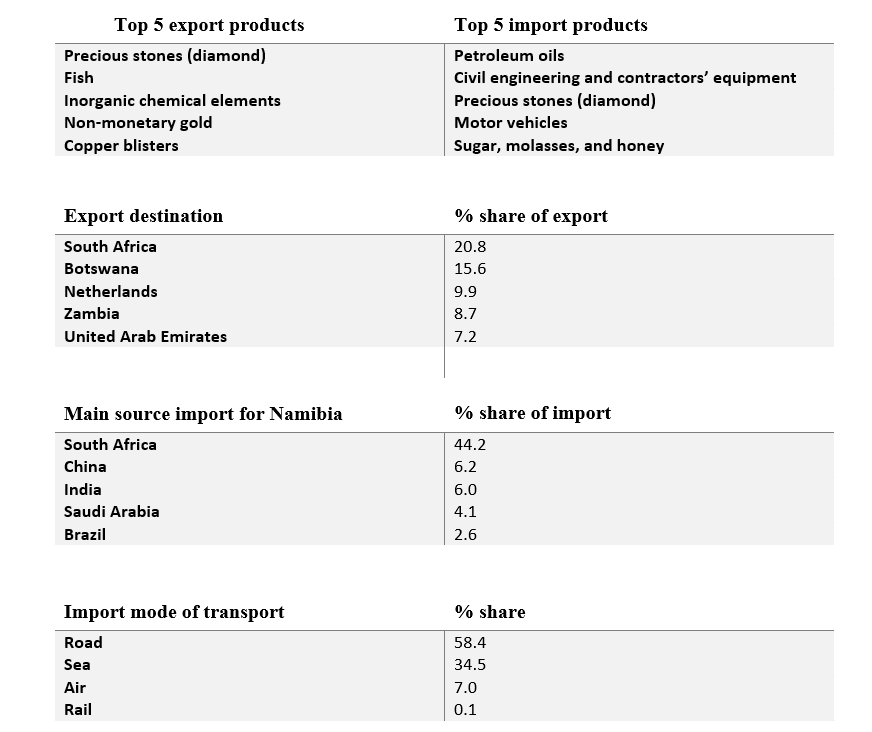
On an annual basis, total export earnings increased by 27.9% year on year. This resulted from an increase in the exports earnings recorded for commodities such as petroleum oils, precious stones, and non-monetary gold
Import bill dropped by 17.7% for March 2022 when compared to February 2022. This was due to a decline in the import of vessels, inorganic chemical elements, ores, and concentrates of base metals, iron and steel bars, and other plastics in primary form
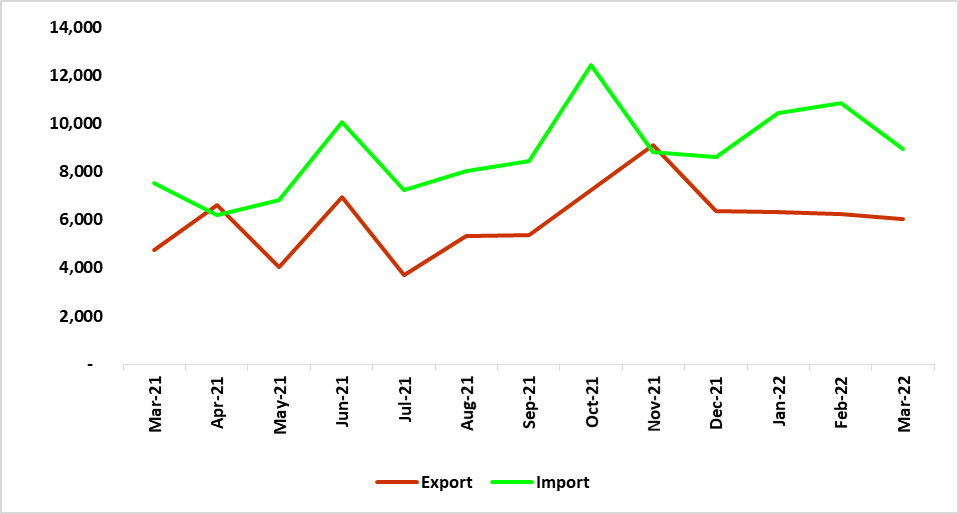
On an annual basis, total imports increased by 18.3%. This was influenced by an increase in the importation of petroleum oils, motor vehicles, and manufacturers of base metals (See figure 1 below)
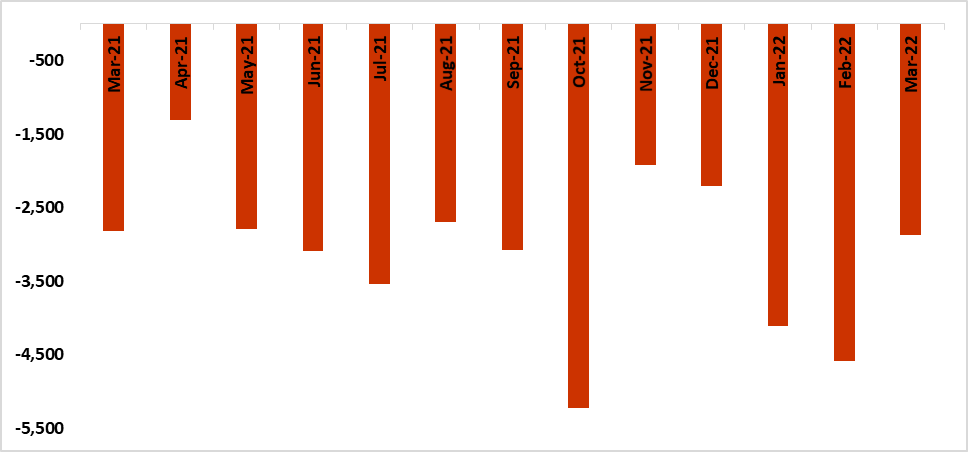
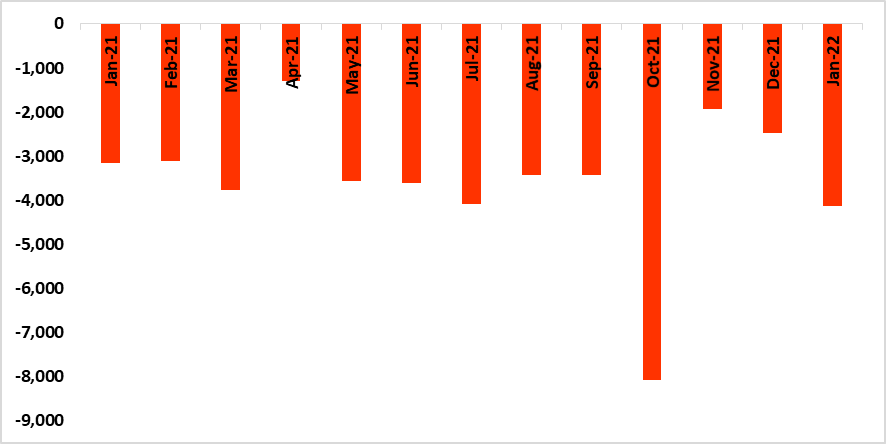
The trade balance increased by 2.10% for March 2022 in relation to the same period last year (See figure 2)
Figure 1: Export and Import value N$ million, (March 2021 – March 2022)
Source:
Namibia Statistics Agency & HEI RESEARCH
Figure 2: Trade Balance (March 2021 - March 2022)
Source: NSA & HEI RESEARCH
Outlook
The country’s trade deficit improved in relation to the previous month. Maintaining the appropriate balance of imports and exports remains crucial thus prioritizing investments to boost the productivity of commodities the country has a comparative advantage is vital to narrowing the country’s trade deficit.
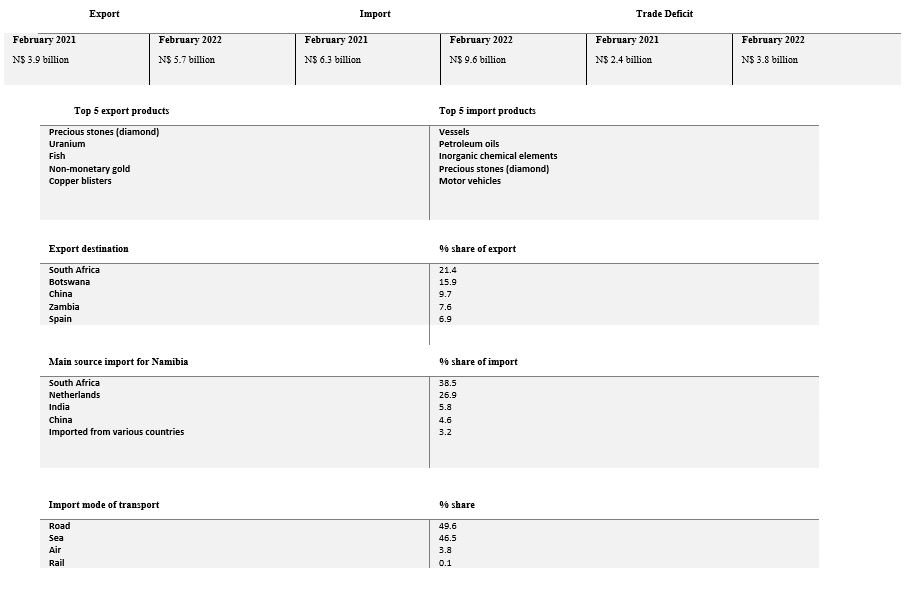
Total export earnings declined by 8.9% for February 2022 when compared to January 2022. This was attributed to a drop in the exports of non-monetary gold, fish, inorganic chemical, fruits, and nuts
On an annual basis, total exports earnings increased by 47.1% year on year. This resulted from an increase in the exports earnings recorded for commodities such as precious stones, uranium, and copper blisters
Import bill dropped by 7.8% for February 2022 when compared to January 2022. This was due to a decline in the import of copper ores and concentrates, petroleum oils, road motor vehicles, and fertilizers
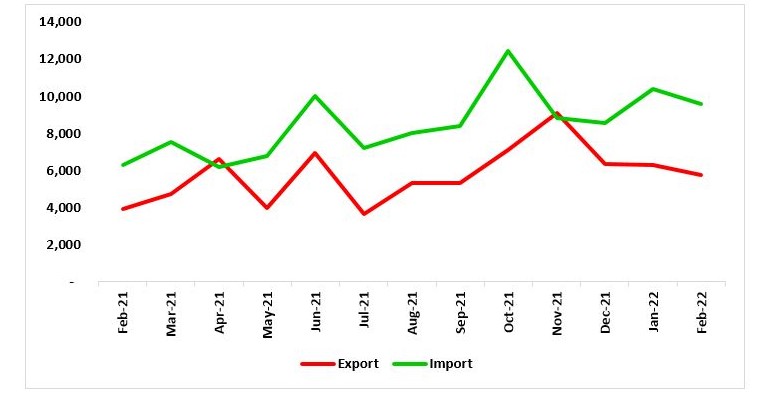
On an annual basis, total imports increased by 51.7%. This was influenced by an increase in the importation of vessels, inorganic chemical elements, and motor vehicles (See figure 1 below)
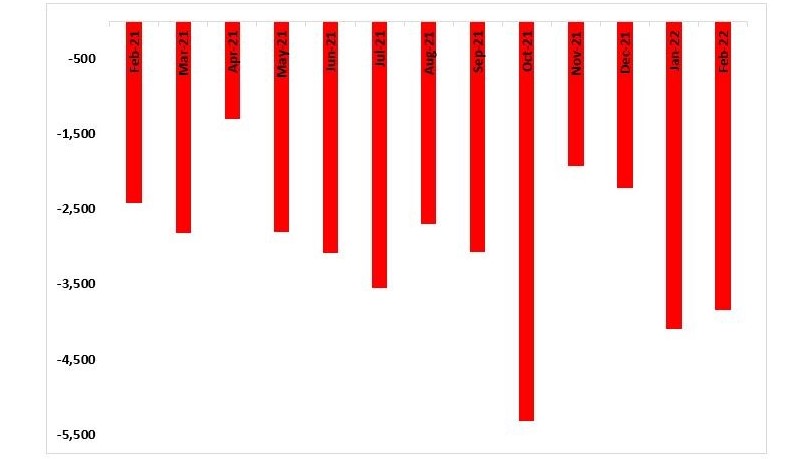
The trade balance increased by 58.9% for February 2022 in relation to the same period last year (See figure 2 below)
Figure 1: Export and Import value N$ million, (February 2021 – February 2022)
Source:
Namibia Statistics Agency & HEI RESEARCH
Figure 2: Trade Balance (February 2021 - February 2022)
Source:
NSA & HEI RESEARCH
Outlook
The country’s trade deficit continues to widen. Given the ambiguous current economic environment whereby energy and commodity prices continue spurring investments to improve local procurement of food production is of utmost importance. The beneficiation and value addition of raw materials in the domestic market should be explored.
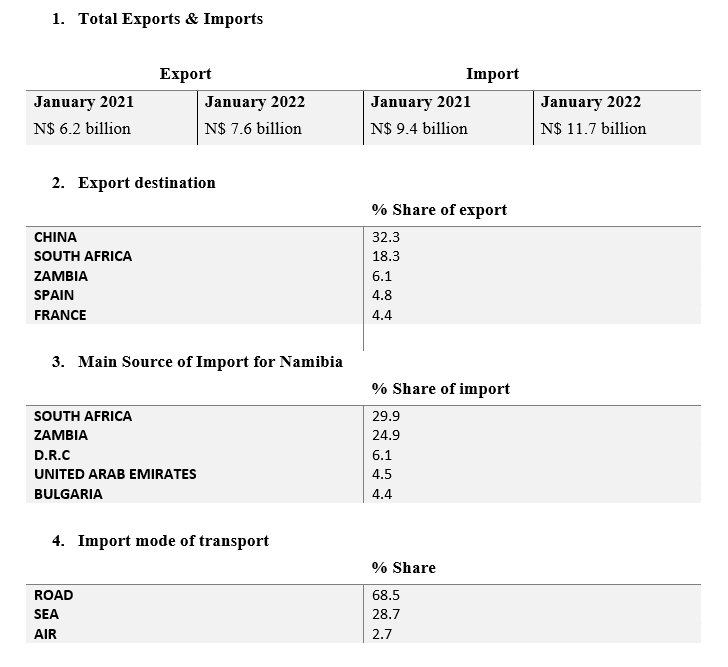
Namibia’s total export earnings declined by 24% for January 2022 when compared to December 2021. This was due to a decline in the exports of copper blisters, precious stones, inorganic chemical elements, fruits, and nuts
On an annual basis, total exports earnings increased by 22%. This resulted from an increase in the exports earnings recorded for commodities such as copper blisters, uranium, non-monetary gold, and fish
Namibia’s
import bill dropped by 6.0% for January 2022 when compared to December
2021. This came as a result of a decline in the import products of
ores
and concentrates of precious metals, road motor vehicles, iron and steel
bars
On an annual
basis, total imports increased by 24.9%. This was influenced by an
increase in the importation of copper blisters, precious stones, fish, and
non-monetary gold (See figure 1 below)
Figure 1: Export and Import value (N$ million), January 2021 – January 2022
Source: Namibia Statistics Agency & HEI RESEARCH
Figure 2: Trade Balance (January 2021 - January 2022)
Source: NSA & HEI RESEARCH
Outlook
Namibia is still
reliant on imports for the majority of goods and dependent on commodity exports.
Prioritization of investments to improve the productivity and enhance value
addition on domestic commodities and the facilitation of access to credit for
businesses remains crucial to improve the country’s trade balance and narrow
trade deficit.
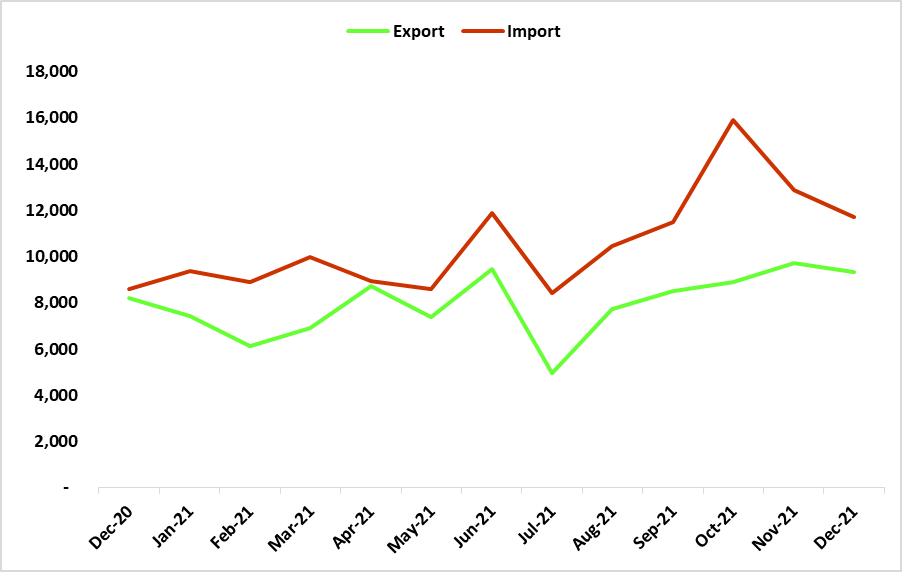
Namibia’s total exports earnings amounted to N$ 9.3 billion for December 2021 up from N$ 8.3 billion that was recorded in December 2020. (See figure 1 below)
China remained the main export market for the country, absorbing 31.4% of all goods exported, followed by South Africa in the second place whose market share of Namibia’s exports with 14% of total exports.
Imports bill amounted to N$11.7 billion for December 2021 up from N$ 8.6 billion that was recorded in December 2020. (See figure 1 below)
Namibia sourced the majority of its imports mainly from South Africa, Zambia, D.R.C, China, and India for December 2021
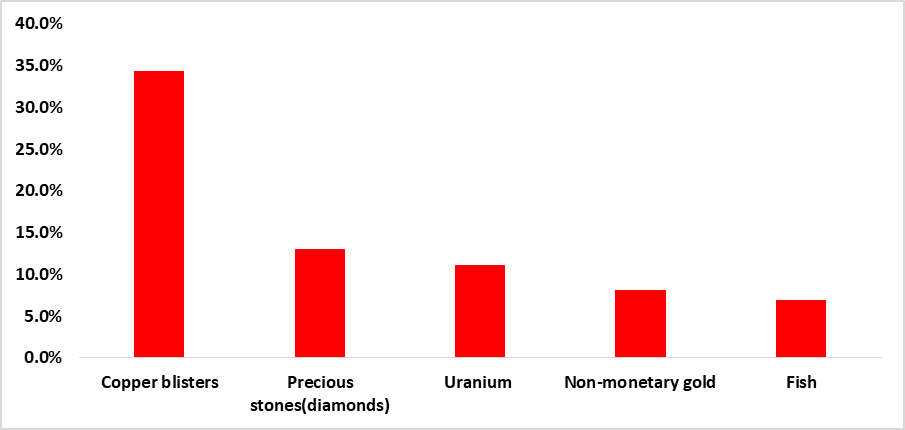
Namibia’s largest export and import commodity for December 2021 was copper blisters, accounting for 34.4% and 29.2% respectively. (See figures 3 & 4 below)
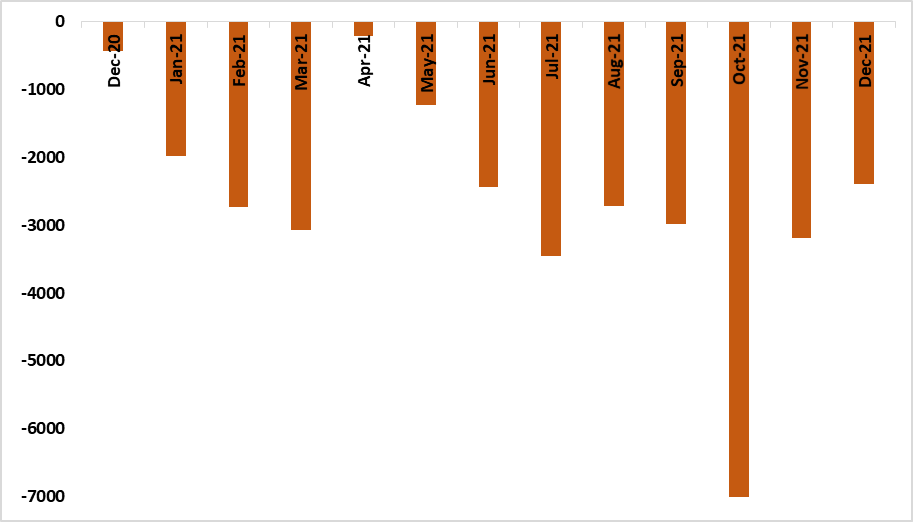
The county’s trade balance stood at N$ 2.4 billion for December 2021, up from N$ 425 million recorded for December 2020. (See figure 2 below)
COMESA economic region took up the largest percentage share of imports by economic region accounting for 32.9% followed by SACU, accounting for 32.7% and MERCOSUR took up the least percentage share of exports of only 0.3%
During the month of December 2021, the main mode of transport used for the majority of the products exported accounting for 44.7% was via sea and the majority of the products imported reached the country by road which accounted for 71.4% of total products imported.
Analysis
Namibia’s
total export earnings declined by 3.8% for December 2021 when compared to November
2021. This came as a result of a decline in the exports of uranium,
precious stones, ores and concentrates of base metals, and non-monetary gold
On an
annual basis, total exports earnings increased by 14.1%. This was
influenced by an increase in the exports earnings recorded for commodities
such as copper blisters, uranium, and non-monetary gold as a result of a
boost in trade flow
Namibia’s
import bill dropped by 9.0% for December 2021 when compared to November
2021.This was due to a decline in the import products of petroleum oils,
other meat and edible offal, and motor vehicles
On an
annual basis, total imports increased by 36.2%. This was driven by an increase
in the importation of copper blisters, ores and concentrates precious metals,
copper ores and concentrates, motor vehicles, and rubber tyres (See figure
1 below)
Figure 1: Export and Import value (N$ million), December 2020 – December 2021
Source: Namibia Statistics Agency & HEI RESEARCH
Figure 2: Trade Balance (December 2020 – December 2021)
Source: NSA & HEI RESEARCH
Figure 3: Top 5 Import products % share of total imports, December 2021
Source: NSA & HEI RESEARCH
Figure 4: Top 5 Export products % share of total imports, December 2021
Source: NSA & HEI RESEARCH
Outlook
Minerals
continues to dominate Namibia’s export and import basket with copper leading
since 2018. Local value addition on export commodities is crucial to boost
exports, create employment opportunities and help the economy grow. We
anticipate slow growth in the country’s trade balance in the medium term. This
is due to a lack of investments to boost local exports, negative external
shocks that influence commodity prices and the continuous negative impact of
the Covid-19 pandemic.
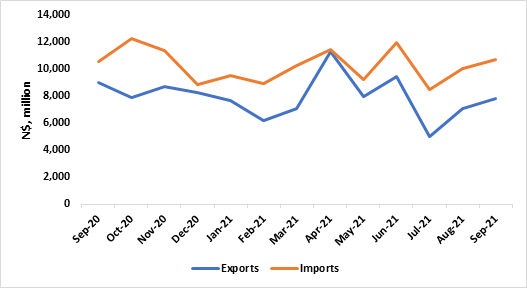
Namibia’s
total exports earnings amounted to N$ 7.2 billion for September 2021 down from N$
8.9 billion recorded for the same period last year. (See figure 1 below)
China
remains the main export market for the country for September 2021, absorbing 34.6%
of all goods exported ahead of South Africa in the second place whose market
share of Namibia’s exports stood at 26.9% of total exports
Imports
bill amounted to N$10.3 billion for September 2021 up from N$ 10.5 billion that
was recorded during the same period last year. (See figure 1 below)
During
the month of September 2021, Namibia sourced the majority of imports mainly from South Africa, Zambia,
D.R.C, India, and China
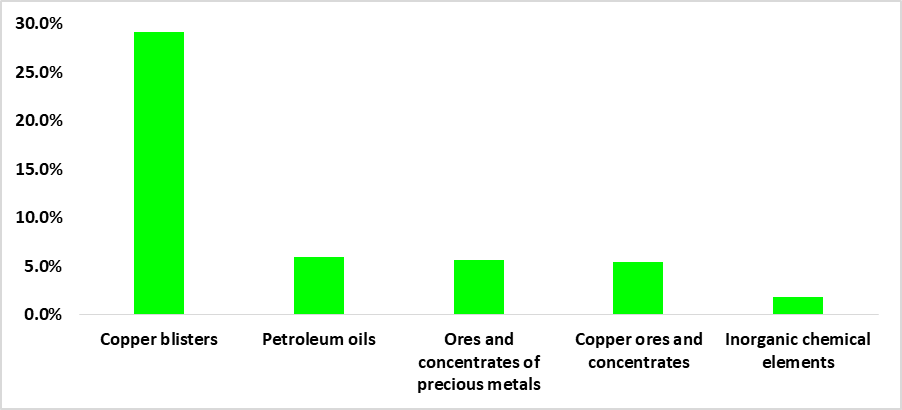
Copper
was Namibia’s largest export and import commodity for September 2021, accounting
for 35.5% and 25.4% respectively. (See figure 3&4 below)
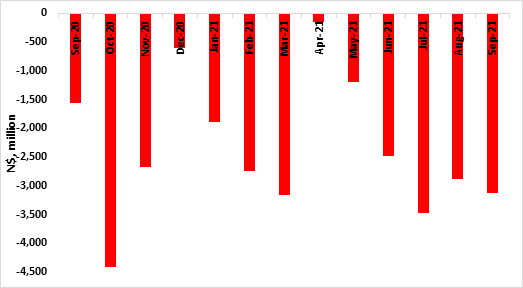
The
county’s trade balance stood at N$ 3.1 billion for September 2021, up from N$
1.5 billion recorded for September 2020. (See figure 2 below)
SACU
economic region and BRIC took up the largest percentage share of exports by economic
region accounting for 34.9% each followed by EU accounting for 10.1% and the
COMESA took up the least percentage of exports of 8.4%
The
majority of the products exported during the month of September 2021 reached
their destination using the sea as a mode of transport accounting for 44.1% and
the majority of the imported products reached the country by road which
accounted for 73.6% of total products imported
Analysis
Namibia’s
total export earnings decreased by 8.1% for September 2021 in relation to the
previous month. This came as a result of a decline in the export of uranium or
thorium ores and concentrates, fish, pearls and precious or semiprecious
stones, unworked or worked and gold, non-monetary (excluding gold ores and
concentrates) and the export of live animals
On
an annual basis total exports earnings declined by 19.7%. This was mainly
attributed to a decline in the exports earnings recorded for copper, fish, and
live animals. This was due to a negative impact of Covid-19 restrictions.
Namibia’s
import bill declined by 3.6% for September 2021 when compared to August 2021.
This was influenced by an increase in the import of medicinal (pharmaceutical) products, ships, boats, copper, and inorganic chemicals
On
an annual basis total imports increased by 1.9% as a consequence of an increase
in the importation of petroleum oils and fuels, precious or semiprecious stones (Diamond), tubes, and
pipes.(See figure 1 below)
Figure 1: Export and Import value, (September 2020- September 2021)
Source: NSA & HEI RESEARCH
Figure 2: Trade Balance (September 2020 - September 2021)
Source: NSA & HEI RESEARCH
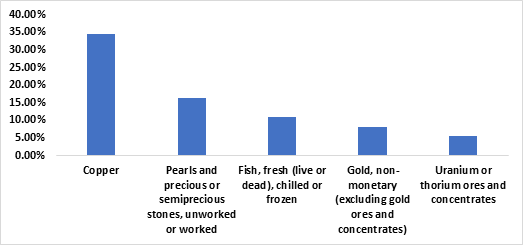
Figure 3: Top 5 Export products % share of total exports, Namibia (September 2021)
Source: NSA & HEI RESEARCH
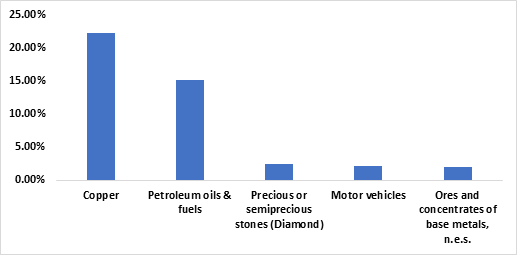
Figure 4: Top 5 Import products % share of total imports, Namibia (September 2021)
Source: NSA & HEI RESEARCH
Outlook
Boosting
exports is of utmost importance for the country’s economic growth. The
implementation of aggressive vaccine rollouts remains essential to caution the
negative impact of covid-19 on commodity prices. Additionally, there is a need
to facilitate access to credit for export companies and investment in value
addition for the main commodities that are exported. This will improve the
country’s trade balance in the medium term.
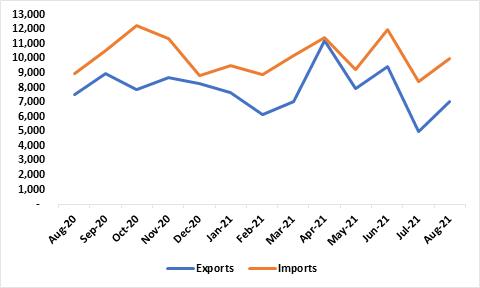
Namibia’s total exports earnings amounted to N$ 7.1
billion for August 2021 down from N$ 7.3 billion that was recorded for the same
period last year. (See figure 1 below)
China emerged as the main export market for the
country for August 2021, absorbing 29.6% of all goods exported, ahead of South
Africa in the second place whose market share of Namibia’s exports stood at
17.9% of total exports.
Imports bill amounted to N$10 billion for August 2021
up from N$ 8.9 billion that was recorded during the same period last year. (See
figure 1 below)
During the month of August 2021 Namibia sourced the
majority of imports mainly from South Africa,
Zambia, D.R.C, Oman, and China
Copper was Namibia’s largest export and import commodity
for August 2021, accounting for 34.6% and 22.2% respectively. (See figure
3&4 below)
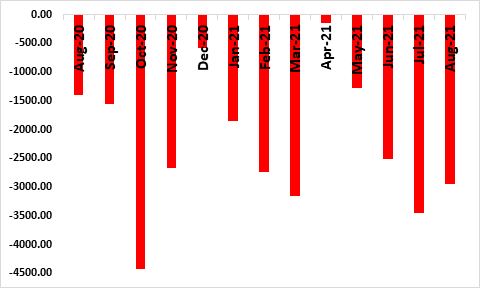
The county’s trade balance stood at N$ 2.9 billion for
August 2021, up from N$ 1.3 billion recorded for August 2020. (See figure 2
below)
SACU economic region took up the largest percentage
share of exports by economic region accounting for 30.3% followed by BRIC,
accounting for 29.7% and the EFTA took up the least percentage of exports of
0.2%
The majority of the products exported during the month
of August 2021 reached their destination using the sea as a mode of transport
accounting for 56.6% and the majority of the imported products reached the
country by road which accounted for 69.8% of total products imported
Analysis
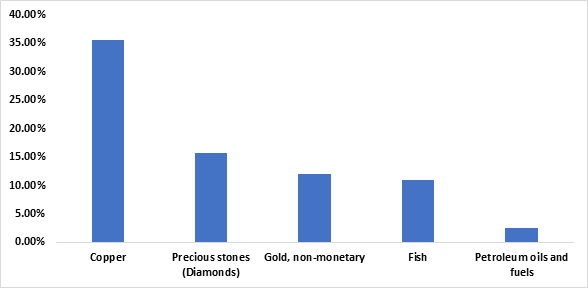
Namibia’s total export earnings increased by 41.5% for August 2021 in relation to the previous month. This came as a result of an increase in the export of copper, pearls , and precious or semiprecious stones, unworked or worked and gold, non-monetary (excluding gold ores and concentrates), and the export of ores and concentrates of base metals
On an annual basis total exports earnings declined by 6.2%. This was mainly attributed to a decline in the exports earnings recorded for pearls and precious or semiprecious stones, unworked or worked and uranium or thorium ores and concentrates. This was due to the negative impact of Covid-19 on global commodity prices
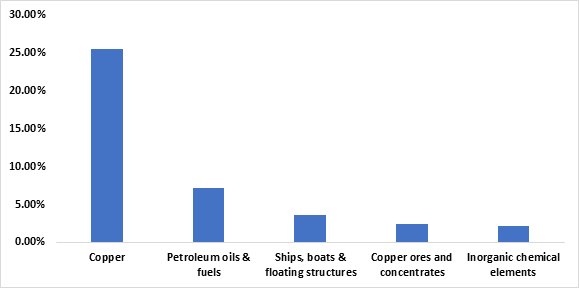
Namibia’s import bill increased by 18.5% for August 2021 when compared to July 2021. This was influenced by an increase in the import of petroleum oils and fuels, copper, and the import of motor vehicles
On an annual basis total imports increased by 12.1% as a consequence of an increase in the importation of petroleum oils and fuels, precious or semiprecious stones (Diamond), and motor vehicles. (See figure 1 below)
Figure 1: Export and Import value (N$), (August 2020- August 2021)
Source: NSA & HEI RESEARCH
Figure 2: Trade Balance (August 2020 - August 2021)
Source: NSA & HEI RESEARCH
Figure 3: Top 5 Export products % share of total exports, Namibia (August 2021)
Source: NSA & HEI RESEARCH
Figure 4: Top 5 Import products % share of total imports, Namibia (August 2021)
Source: NSA & HEI RESEARCH
Outlook
Given the
current economic environment, aggressive vaccine rollouts to caution the negative impact
of covid-19 on commodity prices and investment in value addition for the main
commodities that Namibia exports will help to boost exports for Namibia in the
short to medium term. This will improve the country’s trade balance and lead to
economic growth.