Report by Turimuye Uandara
Executive summary
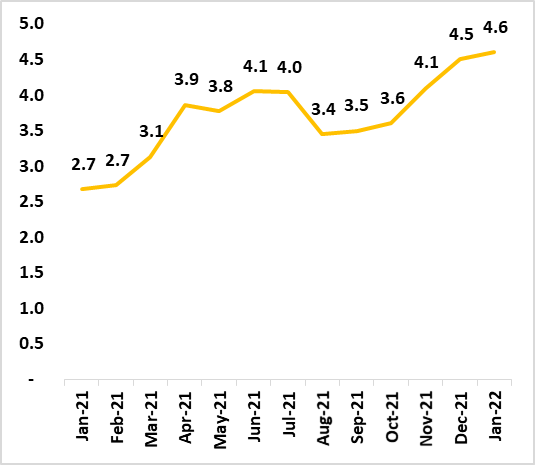
- The annual inflation rate for February 2022 increased to (4.5%), up from (2.7%) recorded for the same period last year. See figure 1
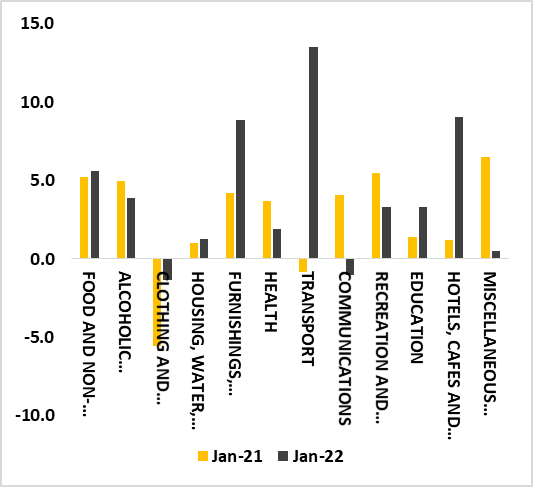
- The main drivers of an increase in the annual inflation rate were transport, hotels, cafes and restaurants, furnishing, household equipment, and maintenance of the house categories. See figure 2
- On a monthly basis, inflation declined by 0.2% this was influenced by health as demand for outpatient services, medical, dental, and paramedical decreased
Analysis
- The transport category recorded an increase in the annual inflation rate from (0.2%) to (13.2%). This was mainly influenced by the operation of personal transport equipment (fuel costs)
- Hotels, cafes, and restaurants recorded an increase in the annual inflation rate from (-0.8%) to (9.0%). This was driven by an increase in the demand for accommodation services
- Furnishings, household equipment, and routine maintenance of the house recorded an increase in the annual inflation rate from (3.5%) to (8.2%) as a consequence of an increase in the price levels of goods and services for routine household maintenance
Outlook
- We anticipate that the annual inflation rate for March 2022 will increase. This will be driven by the transport category due to an increase in fuel prices as announced by the Ministry of Mines and Energy
- Additionally, sin tax price adjustments will also contribute to a rise in overall inflation
Figure 1: Annual Inflation rate

Figure 2: Categorical analysis Year on Year %, Namibia