Executive Summary
- In January 2024, the annual inflation rate declined to 5.4%, compared to the 7.0% recorded in January 2023, on a monthly basis inflation slightly increased compared to the 5.3% recorded in December 2023 (Figure 1)
- Between January 2023 and January 2024, the lowest monthly inflation rate occurred in December 2023
- The main contributors to the decline in annual inflation were food and non-alcoholic beverages, transport, and miscellaneous goods and services (Figure 2)
- On a monthly basis, price levels in Namibia increased by 1.3%, compared to a deflation of 0.1% recorded during the previous month
Analysis
- Food and non-alcoholic beverages, which account for 16.5% of the inflation basket, recorded an annual inflation rate of 6.5% during January 2024, compared to 14.0% recorded in January 2023. This marks a slower increase compared to the 22.3% witnessed during the same month in the previous year. The slow increase in the annual inflation rate of this subcategory was mainly observed in the price levels of maize meal/grain (from 37.2% to -7.5%); bread, cake flour (27.1% to -1.7%); macaroni, spaghetti, and noodles (18.9% to 0.3%); mealie rice/malt (from 19.2% to 2.6%); and bread (from 19.2% to 5.5%)
- The transport category, which accounts for 14.3% of the inflation basket, recorded an annual change of 6.1% during January 2024, compared to the 11.1% recorded in January 2023. The slower increase in the annual inflation rate for this component was reflected mainly in the operation of personal transport equipment from (15.9% to 6.7%) specifically parking fees and the prices of fuel
- Miscellaneous goods and services, accounting for 5.39% of the consumer basket, recorded an annual change of 4.1% during January 2024, compared to the 7.2% recorded in January 2023. This was driven by a decline in demand for insurance services which declined to 4% compared to 15.9% recorded in January 2023
- Core inflation stood at 4.9%, while headline inflation accelerated to 5.4% from December’s 5.3%, translating into a 0.5% difference between core and headline inflation (See Figure 1)
Figure 1: Annual Inflation Rate, Namibia (January 2023 – January 2024)

Source: NSA & HEI Research
Figure 2: Sub-Categorical analysis (%) change Year on Year (January 2023 – January 2024)

Source: NSA & HEI Research
Outlook
The decline in the annual inflation rate indicates a somewhat volatile trajectory, suggesting that while there has been a reduction in inflation, it remains subject to fluctuation. We anticipate that the trend of weakening inflation will continue. However, uncertainties and external factors such as fluctuations in oil prices and the global demand for commodities could contribute to fluctuations in inflation rates throughout the year, necessitating close monitoring and adaptability in response to changing economic conditions.
Executive Summary
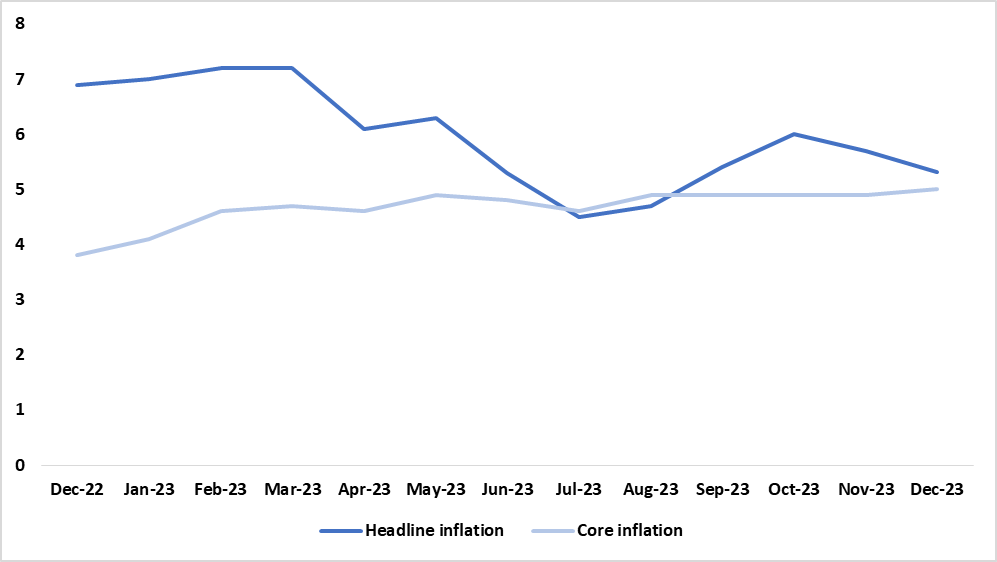
- In December 2023, the annual inflation rate slowed to 5.3%, compared to the 6.9% recorded in December 2022 and the 5.7% recorded in November 2023 (Figure 1)
- The average annual inflation rate from January to December 2023 was estimated at 5.9%
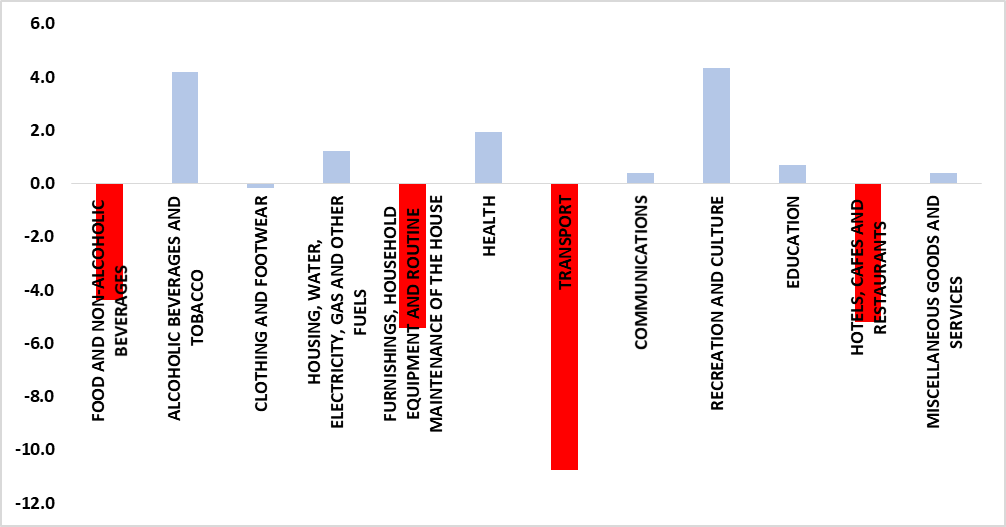
- The main contributors to the decline in annual inflation were transport, furnishings, household equipment, and routine maintenance of houses, hotels, cafes, and restaurants as well as food and non-alcoholic beverages (Figure 2)
- On a monthly basis, the inflation rate slowed to 0.1%, compared to the 0.3% recorded in November 2023 while core inflation increased to 5.0%
Analysis
- The largest changes in annual prices in December 2023 were recreation and culture at 10.0%, and alcoholic beverages and tobacco at 8.4%
- The transport category, which accounts for 14.3% of the inflation basket, recorded an annual change of 4.0% during December 2023, compared to the 14.8% recorded in December 2022. The slow increase in the annual inflation rate for this component was reflected mainly in the lower prices for fuel
- The annual inflation rate for furnishings, household equipment, and routine maintenance of the house which accounts for 5.5% of the consumer basket registered a decline in the annual inflation rate of 5.1% in December 2023 compared to 10.6% recorded in December 2022. This was attributed to a decline in the price levels of goods and services for routine household maintenance which declined to 3.9% compared to 25.8% recorded in December 2022
- Hotels, cafes, and restaurants account for 1.4% of the consumer basket recorded a decline in the annual inflation rate of 6.5% in December 2023 compared to 11.7% recorded in December 2022. This was driven by a decline in demand for accommodation services which declined to 9.4% compared to 20.4% recorded in December 2022
- Core inflation stood at 5.0%, while headline inflation slowed to 5.3% from November’s 5.7%, translating into a 0.3% difference between core and headline inflation.
The gap between core and headline inflation is a concern for long-term inflation trends. A growing difference may indicate the need for proactive measures to control inflation. (See Figure 1)
Figure 1: Annual Inflation Rate, Namibia (December 2022 – December 2023)
Source: NSA & HEI Research
Figure 2: Sub-Categorical analysis (%) change Year on Year (December 2022 – December 2023)
Source: NSA & HEI Research
Outlook
The rate of headline inflation slowed down, decreasing from 9.2% in 2022 to 5.9% in 2023. We expect the ongoing pattern of decreasing inflation to persist into 2024.
Executive Summary
- In November 2023, the annual inflation rate slowed to 5.7%, compared to the 7.0% recorded in November 2022 and the 6.0% recorded in October 2023 (Figure 1).
- The main contributors to the decline in annual inflation were transport, furnishings, household equipment, and routine maintenance of houses, as well as hotels, cafes, and restaurants (Figure 2).
- On a monthly basis, the inflation rate slowed to 0.3%, compared to the 0.8% recorded in October 2023.Core inflation remained at 4.9% for the fourth consecutive month.
Analysis
- The largest changes in annual prices in November 2023 were Recreation and culture at 10.1%, Food and non-alcoholic beverages at 9.2%, Alcoholic beverages and tobacco at 8.0%, Hotels, cafes, and restaurants at 7.7%, Furnishings, household equipment, and routine maintenance of the house at 5.3%, and Miscellaneous goods and services at 5.2%.
- The transport category, which accounts for 14.3% of the inflation basket, recorded an annual change of 5.1% during November 2023, compared to the 18.3% recorded in November 2022. The slow increase in the annual inflation rate for this component was reflected mainly in the lower prices for fuel.
- The annual inflation rate for the Housing, water, electricity, gas, and other fuels component, which accounts for 28.4% of the NCPI, registered an increase of 3.2% during November 2023, compared to the 2.4% witnessed in November 2022. On a monthly basis, the inflation rate stood at 0.0%, compared to 0.3% recorded during the previous month.
- The year-on-year inflation rate for Alcoholic beverages and tobacco registered an increase of 8.0% in November 2023, compared to the 4.8% registered in November 2022. The increase in the annual inflation rate for this category resulted from increases witnessed in both alcoholic beverages (from 5.0% in 2022 to 8.5%) and tobacco (from 4.1% in 2022 to 5.9%). Month-on-month, the inflation rate for this category increased to 0.5%, compared to 0.2% registered in October.
- Core inflation stood at 4.9%, while headline inflation slowed to 5.7% from October’s 6.0%, translating into a 0.8% difference between core and headline inflation. The disparity between core and headline inflation continues to raise concerns about long-term inflation trends, and a widening gap might signal a necessity for more proactive measures to combat inflation (See Figure 1).
Figure 1: Annual Inflation Rate, Namibia (November 2022 – November 2023)

Source: NSA & HEI Research
Figure 2: Sub-Categorical analysis (%) change Year on Year (November 2022 – November 2023)

Source: NSA & HEI Research
Outlook
This has been the first month of slowed inflation after witnessing an uptick in headline inflation in the second half of 2023, though it remains lower compared to the previous year. We expect inflation to continue this new trend for December 2023, both monthly and annually, due to lower fuel prices announced for December 2023.
Executive Summary
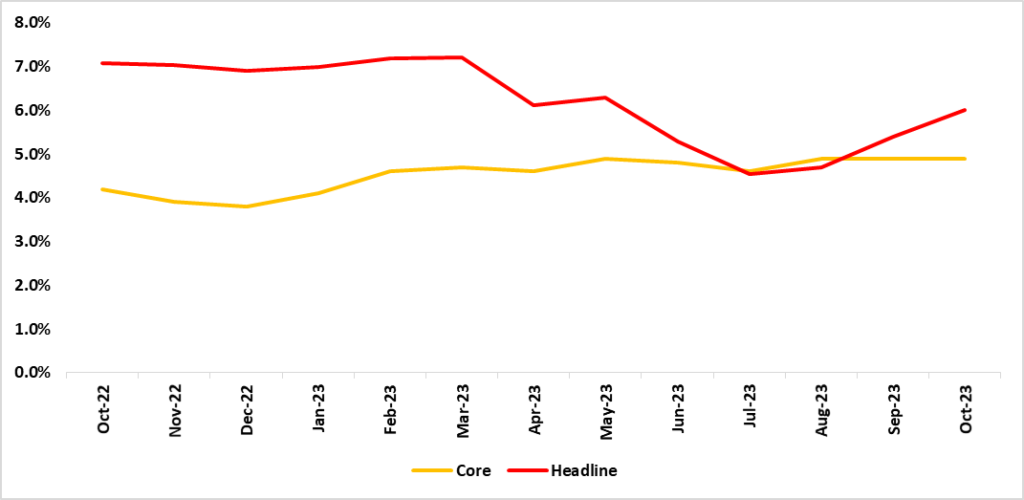
- In October 2023, the annual inflation rate stood at 6.0%, marking an increase compared to the 5.4 % recorded the previous month but a slowdown compared to the 7.1% of October 2022 (Figure 1)
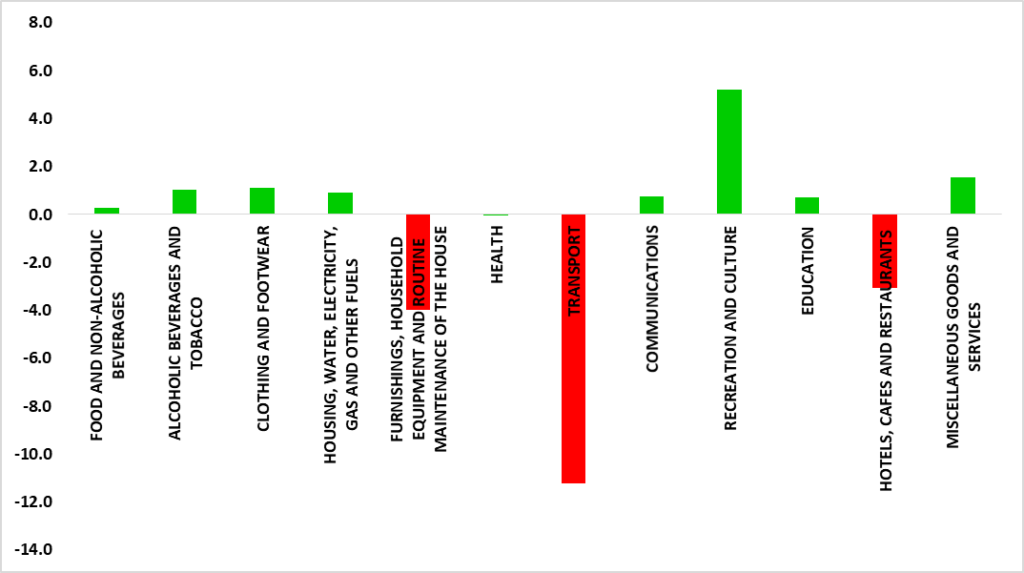
- The main contributors to a decline in the annual inflation were: transport, furnishings, household equipment, and routine maintenance of the houses and hotels, cafes, and restaurants, (Figure 2)
- On a monthly basis, the inflation rate remained the same as that of the previous month at 0.8%. The 0.8% emanated from the categories of transport (from 2.9% to 3.5%), furnishings, household equipment, and routine maintenance of the houses and hotels (from 0.3% to 0.6%), and health (from 0.0% to 0.2%)
Analysis
- The transport category which accounts for 14.3% of the consumer basket registered a decline in the annual inflation rate of 6.6% in October 2023 compared to 17.8% recorded in October 2022. The decline in the annual inflation rate for this component was mainly attributed to decline in petrol and diesel prices which declined to 9.0% from 45.8% recorded in October 2022. However, on a monthly basis, petrol and diesel prices increased significantly from -3.3% to 9.0%
- The annual inflation rate for furnishings, household equipment, and routine maintenance of the house which accounts for 5.5% of the consumer basket registered a decline in the annual inflation rate of 5.6% in October 2023 compared to 9.6% recorded in October 2022. This was attributed to a decline in the price levels of goods and services for routine household maintenance which declined to 4.2% compared to 24.8% recorded in October 2022
- Hotels, cafes, and restaurants account for 1.4% of the consumer basket recorded a decline in the annual inflation rate of 7.5% in October 2023 compared to 10.6% recorded in October 2022. This was driven by a decline in demand for accommodation services which declined to 9.5% compared to 18.8% recorded in October 2022
- Core inflation stood at 4.9% while headline inflation increased to 6.0% from the previous month's 5.4%, translating into a 1.1% difference between core and headline inflation. The disparity between core and headline inflation continues to raise concerns about long-term inflation trends and a widening gap might signal a necessity for more proactive measures to combat inflation. (See Figure 1)
Figure 1: Annual Inflation Rate, Namibia (October 2022 – October 2023)
Source: NSA & HEI Research
Figure 2: Sub-Categorical analysis (%) change Year on Year (October 2022 – October 2023)
Source: NSA & HEI Research
Outlook
Following a declining trend observed since June 2023, headline inflation has now begun to increase on a monthly basis, though it still remains lower compared to the previous year. We expect inflation to decrease in November 2023, both monthly and annually, due to unchanged fuel prices for November 2023.
Executive Summary
- In September 2023, the annual inflation rate slowed to 5.4% compared to 7.1% in September 2022. (Figure 1)
- The main contributors to a decline in the annual inflation were: transport, furnishings, household equipment, and routine maintenance of the houses and hotels, cafes, and restaurants, (Figure 2)
- On a monthly basis, Namibia recorded an inflation rate of 0.8% an increase from 0.4% recorded for August 2023. The increase mainly emanated from the categories of transport (from 0.5 % to 2.9%), alcoholic beverages and tobacco (from 0.5% to 0.8%)
Analysis
- The transport category which accounts for 14.3% of the consumer basket registered a decline in the annual inflation rate of 2.2% in August 2023 compared to 19.5% recorded in August 2022. The decline in the annual inflation rate for this component was reflected mainly in the subcomponent of operation of personal transport equipment which declined to 0.1% compared to 30% recorded in September 2022 attributed to a 3.3% fall in petrol and diesel prices
- The annual inflation rate for furnishings, household equipment, and routine maintenance of the house which accounts for 5.5% of the consumer basket registered a decline in the annual inflation rate of 5.5% in September 2023 compared to 9.4% recorded in September 2022. This was attributed to a decline in the price levels of goods and services for routine household maintenance which declined to 4.5% compared to 25.1% recorded in September 2022
- Hotels, cafes, and restaurants account for 1.4% of the consumer basket recorded a decline in the annual inflation rate of 6.9% in September 2023 compared to 11% recorded in September 2022. This was driven by a downturn in demand for accommodation services which declined to 7.6% compared to 20.4% recorded in September 2022.
- Core inflation stood at 4.9% in September 2023 unchanged from 4.9% recorded in August 2023 and headline inflation increased to 5.4% for September 2023 from 4.7% recorded the previous month. The gap between core and headline inflation could raise concerns about long-term inflation trends. If this gap widens, it may signal a need for more proactive inflation-fighting measures. Figure 1
Figure 1: Annual Inflation Rate, Namibia (September 2022 – September 2023)

Source: NSA & HEI Research
Figure 2: Sub-Categorical analysis (%) change Year on Year (September 2022 – September 2023)

Source: NSA & HEI Research
Outlook
The annual inflation for Namibia indicates a decreasing trend, driven by significant declines in specific categories such as transport and household expenses. The hospitality sector which is used as a proxy for the tourism sector also saw a reduction in inflation due to decreased demand for accommodation services. However, the gap between core and headline inflation raises concerns and calls for vigilant monitoring by the monetary and fiscal authorities to ensure price stability. We anticipate inflation to increase for the transport component due to higher Brent crude oil prices.
Executive Summary
- In August 2023, the annual inflation rate decelerated to 4.7% compared to 7.3% in August 2022. (Figure 1)
- The main contributors to a decrease in the annual inflation were: transport, furnishings, household equipment, and routine maintenance of the houses and hotels, cafes, and restaurants, (Figure 2)
- On a monthly basis, Namibia recorded an inflation rate of 0.4% an increase from 0.3% recorded for July 2023. The increase mainly emanated from the categories of hotels, cafes, and restaurants (from 0.1 % to 1.9%), food and non-alcoholic beverages (from -0.2% to 0.3%), and miscellaneous goods and services (from –0.3% to 0.3%).
Analysis
- The transport category which accounts for 14.3% of the consumer basket registered a decline in the annual inflation rate of 2.2% in August 2023 compared to 23.2% recorded in August 2022. The decline in the annual inflation rate for this component was reflected mainly in the subcomponent of operation of personal transport equipment which declined to 6.1% compared to 35.4% recorded in August 2022 attributed to a 13.1% fall in petrol and diesel prices
- The annual inflation rate for furnishings, household equipment, and routine maintenance of the house which accounts for 5.5% of the consumer basket registered a decline in the annual inflation rate of 6.6% in August 2023 compared to 8.6% recorded in August 2022. This was attributed to a decline in the price levels of goods and services for routine household maintenance
- Hotels, cafes, and restaurants account for 1.4% of the consumer basket recorded a decline in the annual inflation rate of 7.8% in August 2023 compared to 9.3% recorded in August 2022. This was driven by a downturn in demand for accommodation services which declined to 9.2% compared to 16.5% recorded in August 2022.
- Core inflation increased compared to headline inflation between July and August 2023. Core inflation stood at 4.8% in August from 4.4% recorded in July 2023 and headline inflation increased from 4.5% for August to 4.7%. The slight gap between core and headline inflation could raise concerns about long-term inflation trends. If this gap widens, it may signal a need for more proactive inflation-fighting measures. Figure 1
Figure 1: Annual Core and Headline Inflation Rate, Namibia (August 2022 – August 2023)

Source: NSA & HEI Research
Figure 2: Sub-Categorical analysis (%) change Year on Year (August 2022 – August 2023)

Source: NSA & HEI Research
Outlook
Although the annual inflation rate has shown a deceleration compared to the previous year, recent months have witnessed some upward pressure on monthly inflation. This overall decline in annual inflation can be attributed to a significant drop in inflation within categories such as transportation, furnishings, household equipment, and routine home maintenance.
However, the main current inflation risk stems from the increasing Brent crude oil prices due to growing expectations of a limited oil supply, combined with the strength of the US dollar. We anticipate that monthly inflation specifically for the transport category will increase for September 2023 due to recent diesel price hikes, which were announced by the Ministry of Mines and Energy and took effect on September 6, 2023.