Executive summary
- The annual inflation rate for December 2022 increased to 6.9%, up from 4.5% recorded for the same period last year. (figure 1)
- The main drivers of an increase in the annual inflation rate were “transport”, “food & non-alcoholic beverages”, “alcoholic beverages & tobacco” and “housing, water, electricity, gas, and other fuels” categories. (figure 2)
- On a monthly basis, Namibia recorded an inflation rate of 0.3% in December 2022 a decline from 0.5% that was recorded for November 2022
- The main contributors to the monthly inflation rate recorded in December 2022 were mainly food and non-alcoholic beverage (2.2%) and hotels, cafes, and restaurants (0.7%)
- The annual inflation rate for the year 2022 averaged 6.1%
Analysis
- The annual inflation rate for housing, water, electricity, gas, and other fuels which accounts for the highest (28.5%) of the consumer basket increased by 2.1% during December 2022 compared to 1.2% registered in December 2021. This came as a consequence of an increase in the costs of “electricity, gas and other fuels” and “rental payment for dwelling”
- The annual inflation rate for the transport category which accounts for 14.3% of the consumer basket continues to be the main driver of the overall inflation, increasing by 14.8% for December 2022 compared to 14.3% recorded in December 2021. The increase in the transport component was mainly driven by an increase in the price levels of operation of personal transport equipment (parking fees and lubrication)
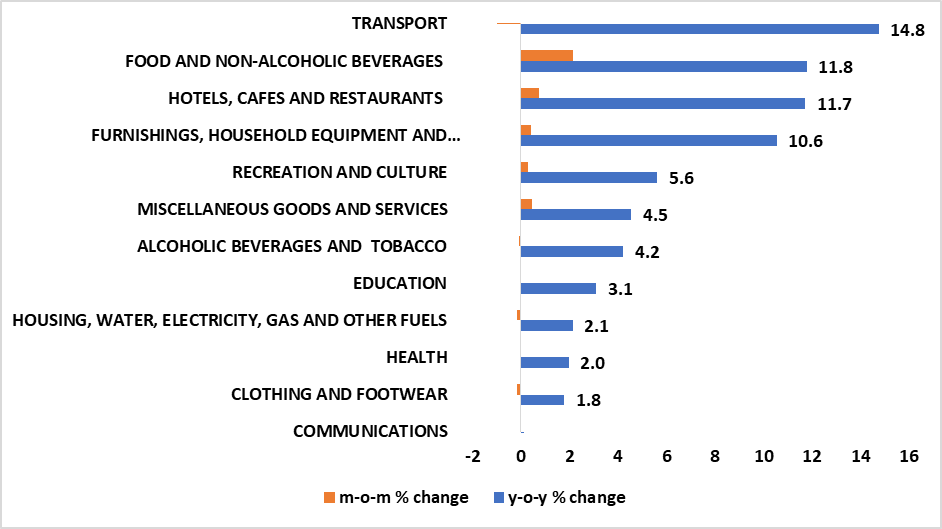
- Food and non-alcoholic beverages which accounts for 16.5 percent of the NCPI basket annual inflation increased by 11.8% during the month of December 2022 compared to 5.1 percent recorded during December 2021 due to an increase in the price levels of vegetables, bread, and cereal, sugar, jam, honey, syrups, chocolate, and oils and fats. (figure 3)
Outlook
- We expect inflation to stabilize for 2023 and this could bring an end to the interest rate hike cycle globally by Central Banks in the medium term
Figure 1: Annual Inflation rate
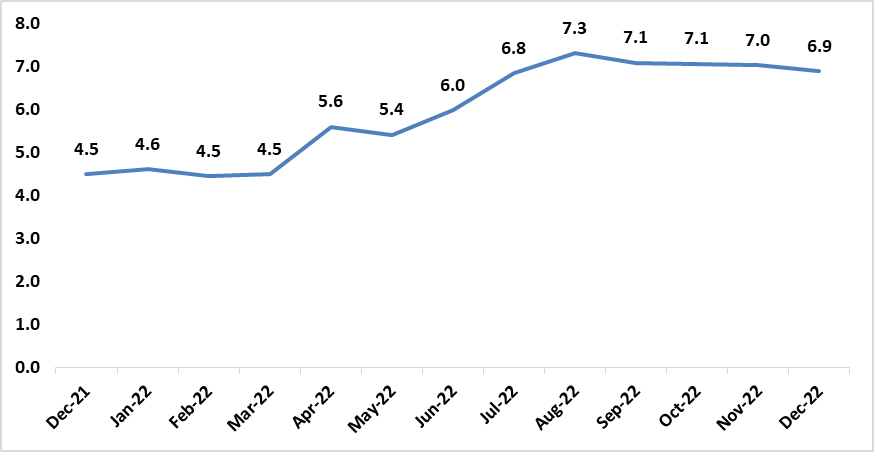
Figure 2: Categorical analysis, contribution to inflation % of total change
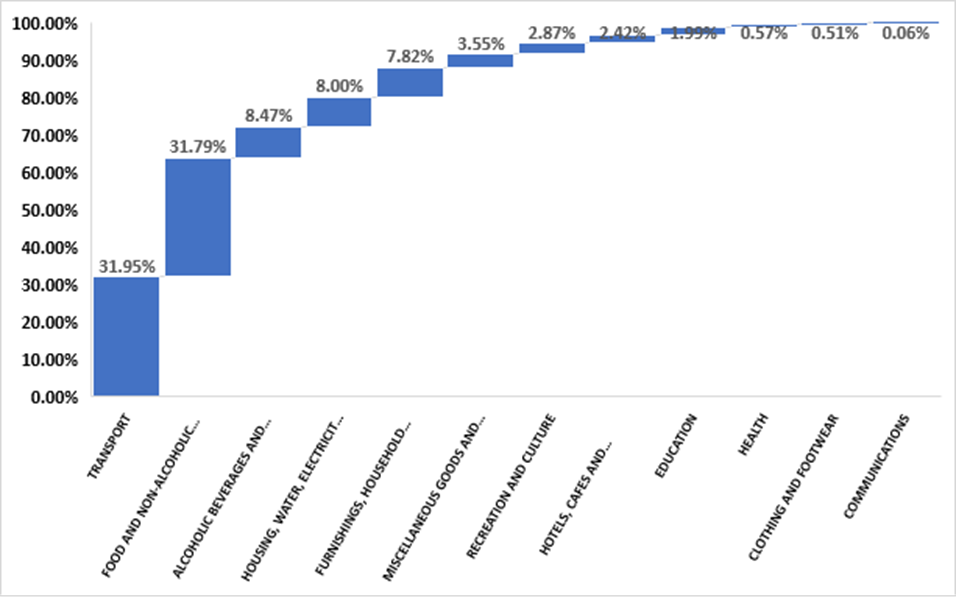
Figure 3: Categorical analysis YoY and MoM % changes, Namibia