Executive Summary
| Export | Export | Import | Import | Trade Deficit | Trade Deficit |
| July 2021 N$ 3.6 billion | July 2022 N$ 7.2 billion | July 2021 N$ 7.2 billion | July 2022 N$ 11.5 billion | July 2021 N$ 3.5 billion | July 2022 N$ 4.2 billion |
| Top 5 export products | Top 5 import products |
| Precious stones(diamonds) Fish Uranium Non-monetary gold Petroleum oils | Petroleum oils Copper ores and concentrates Ores and concentrates of precious metals Pearls and precious or semiprecious stones Civil engineering and contractors |
| Export destination | % share of export |
| Botswana South Africa China Zambia Netherlands | 20.5 19.8 10.0 8.8 6.6 |
| Main source import for Namibia | % share of import |
| South Africa Peru Bulgaria Imported from various countries India | 36.2 12.0 6.3 6.1 5.6 |
| Import mode of transport | % share |
| Sea Air Road Rail Multimodal | 35.0 33.5 31.4 0.0 0.0 |
Analysis
- Total export earnings declined by 14.8% for July 2022 when compared to June 2022. This was influenced by a decrease in uranium, fish, precious stones (diamonds), ores and concentrates of base metals, and printed matter
- On an annual basis, total export earnings increased by 99.6 % year on year on the back of the base effect of the Covid-19 pandemic. This resulted from an increase in the export earnings recorded for commodities such as precious stones (diamonds), uranium, petroleum oils, inorganic chemical elements, and copper ores and concentrates. This is an indication that the mining sector outperforms other sectors in exports earnings
- Import bills increased by 4.5% for July 2022 when compared to June 2022. This resulted from an increase in copper ores and concentrates, ores and concentrates of precious metals, precious stones (diamonds), motor vehicles for the transportation of goods, and alcoholic beverages
- On an annual basis, the total import bill increased by 60.1% year on year. This was influenced by an increase in the importation of petroleum oils, copper ores and concentrates, ores and concentrates of precious metals, pearls, and precious or semiprecious stones, civil engineering, and contractors’ equipment (See figure 1 below)
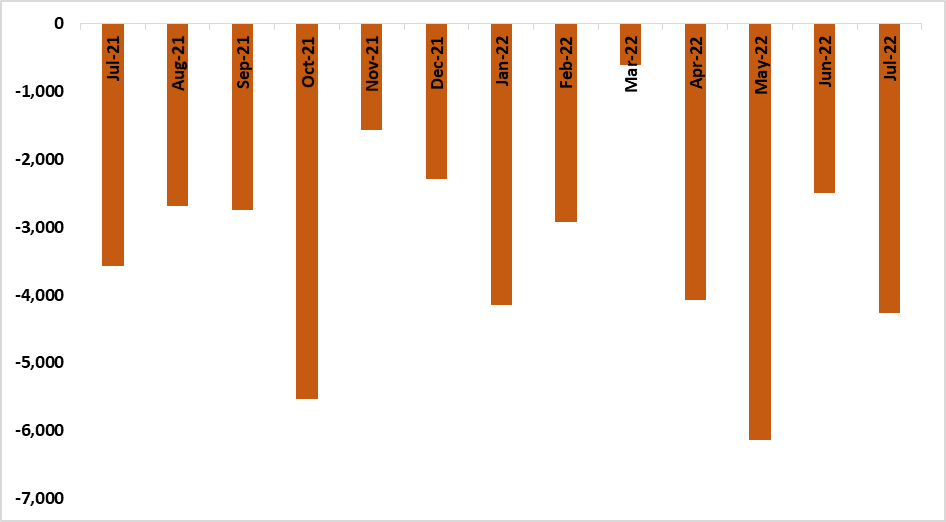
- The trade balance increased by 73.4% for July 2022 in relation to the same period last year (See figure 2)
Figure 1: Export and Import value N$ million, (July 2021 – July 2022)
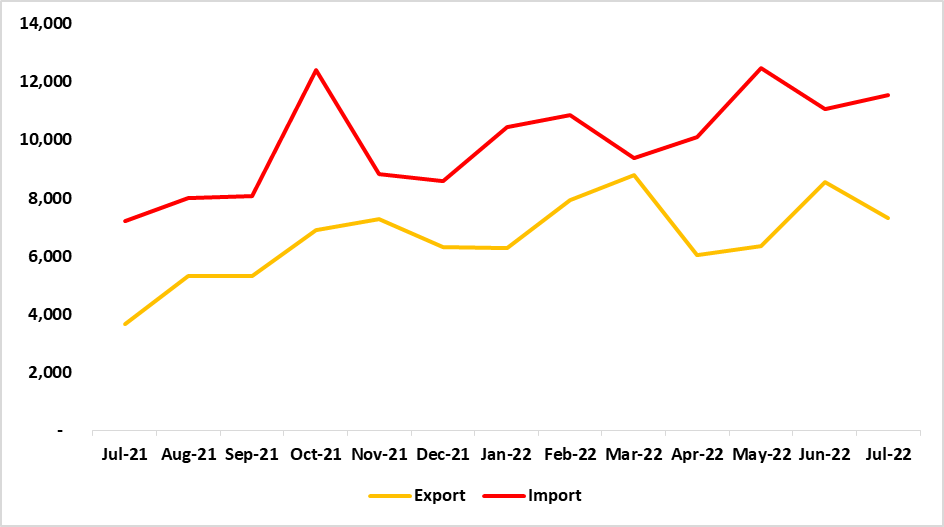
Figure 2: Trade Balance (July 2021 – July 2022)
Outlook
Namibia’s trade activities continue to improve in relation to the Covid-19-induced 2021. However, the country’s trade balance remains constrained when compared to the previous month. The country’s substantial reliance on imports poses a risk to Namibia’s trade given the uncertain current economic environment and the anticipated global economic recession. Boosting local productive capacity remains crucial to improving the overall trade balance for Namibia, this will trigger investment in value addition for the exported commodities.